Markets consolidating despite historic OPEC deal
Market Overview
Market sentiment still look to be in something of a consolidation mode today amidst a mix of factors including oil China and concern over the Italian referendum is leaving traders in a state of caution. On the positive side, OPEC members agreed to an historic production cut which will lead to the cartel reducing supply from the current around the 33.8 million barrels per day to 32.5m barrels per day.
Furthermore, Russia (not a member of OPEC) has agreed to cutting its own production by 300,000 barrels per day. The price of oil has soared on the news and is up around 10% since the rumours of a deal started circulating yesterday. Another positive for sentiment is the China Manufacturing PMI which beat estimates on both the official and unofficial Caixin data, remaining above 50 and at the highest level on the official data (51.7) since July 2014. However there is increasing concern over the capitalisation of Italian banks ahead of the Italian referendum on Sunday. If the referendum returns a “no” vote to Prime Minister Renzi’s proposed constitutional reforms then the prospect of economic reform becomes much harder, something that the banks badly need to drive growth again.

Wall Street closed just marginally lower last night despite the oil deal, with the S&P 500 -0.3% at 2199. Asian markets were broadly positive with the Nikkei benefitting from the yen weakness to rise by 1.2%. However European markets are taking the cautious route in early moves. In forex markets the dollar strength that looked to resume yesterday has been clipped back again early today, with performance all rather solid across the forex majors. Gold and silver are basically flat on the day and are struggling to claw back any of yesterday’s losses with no real rally of any note, whilst the oil price remains strong and is another percent higher.
Traders will be watching for the stream of Manufacturing PMIs throughout the day to give an indication of how growth trends are moving. The Manufacturing PMIs for the Eurozone are early in the European session with the final Eurozone Manufacturing PMI at 0900GMT which is expected to be in line with the flash of 53.7. The UK Manufacturing PMI is at 0930GMT and is expected to improve mildly to 54.4 (from 54.3). The US ISM Manufacturing PMI is at 1500GMT and is expected to also tick up slightly to 52.1 (from 51.9).
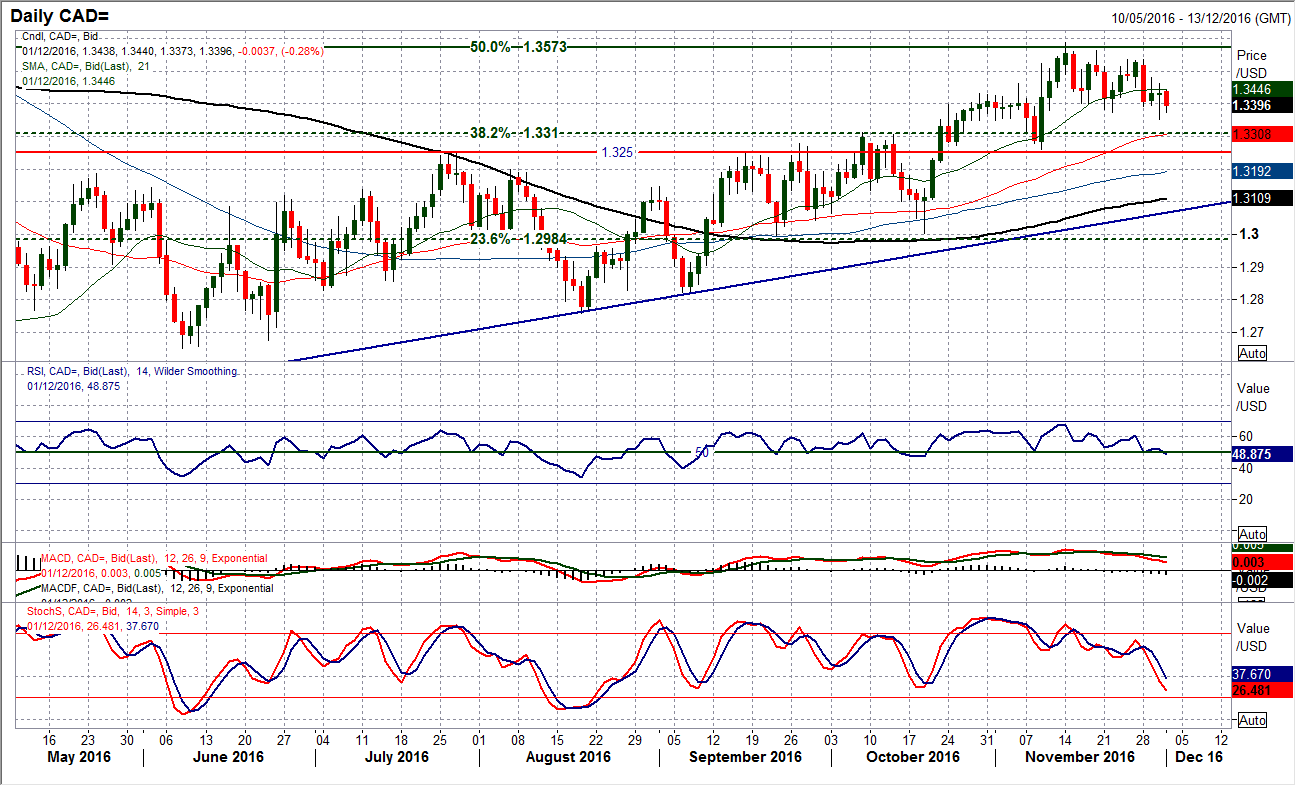
Chart of the Day – USD/CAD
It is remarkable that the dollar strength in the wake of Trump’s victory has done little really to pull USD/CAD much higher. The market has been consolidating in the past few weeks and as the strong dollar breakout has just begun to stall there are signs of a potential correction. However, the breakout above 1.3250 has changed the longer term outlook to bullish once more and corrections are being seen as a chance to buy. The reaction from yesterday’s low at 1.3353 has failed to reignite the bulls and a fairly neutral and tepid candle formation has led the market into today’s early corrective move. The momentum indicators are a concern for the bulls with the RSI now struggling to hang on to the 50 level (around which the buying opportunities have been seen in the past four months). Also, the near term unwinding of the MACD lines suggests a little caution, as does the decline on the Stochastics. The hourly chart shows the importance of the support band 1.3353/1.3400 which needs to hold today. The hourly chart shows a downtrend formation in the past few days and that hourly RSI is failing under 60 and hourly MACD is under neutral in negative configuration. A breach of 1.3353 would re-open 1.3260 and that is where the real test of support comes in. Near term resistance is 1.3460/1.3480.
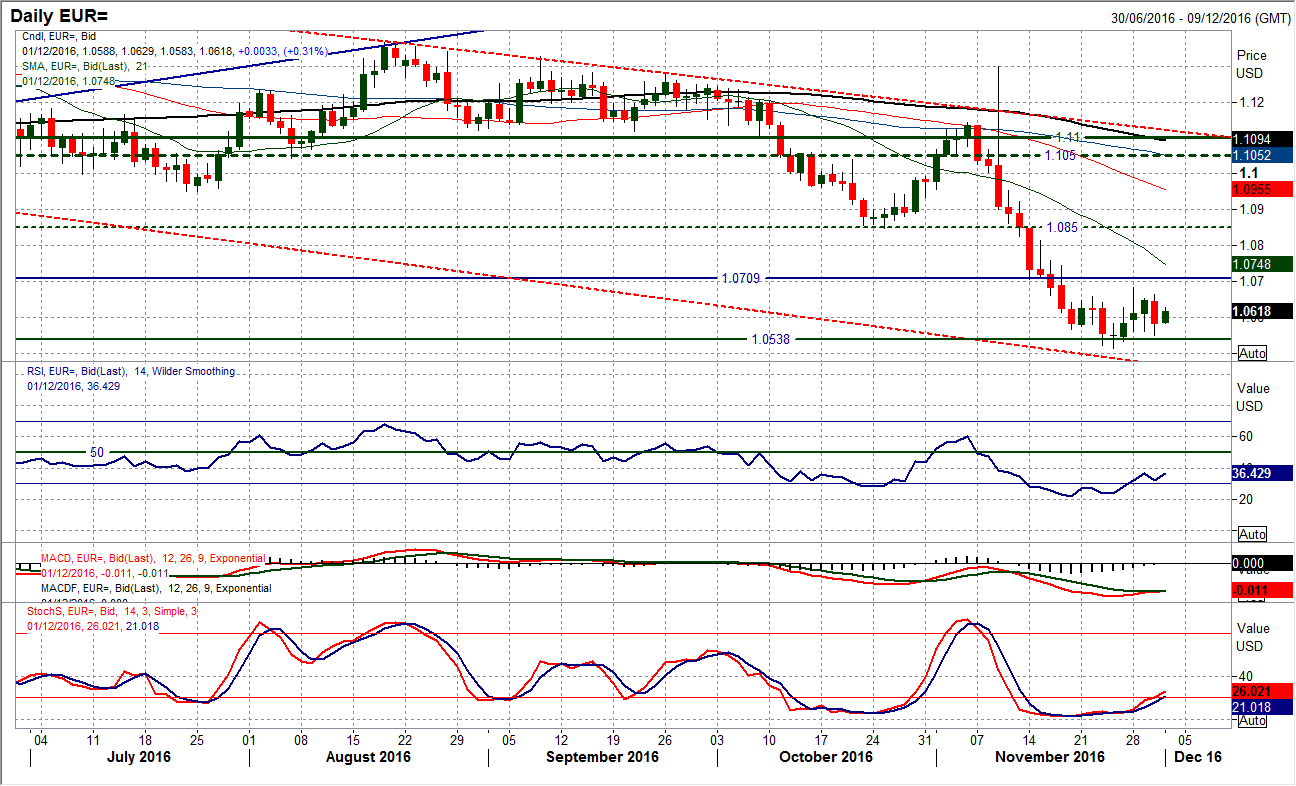
EUR/USD
One again the recovery failed to take hold yesterday as it floundered around the resistance at $1.0660. The bear candle that was formed has maintained the consolidation that continues to build over the past couple of weeks. However looking at the momentum indicators would suggest that the prospects are still improving as the RSI is holding back above 30 and the Stochastics are now rising back above 20 (arguably a buy signal). The longer this consolidation goes on, the more important a break of the key levels will be. The resistance building up between $1.0660 and $1.0685 could turn into a base pattern if the bulls can put together a sustained rally. Today’s reaction back higher suggests that there is no significant selling pressure for now. The hourly chart shows a support around $1.0550/$1.0560 which is growing as a higher low above $1.0515, whilst the hourly momentum is neutral with a mild positive bias today. The market is in consolidation mode and for now we must treat it as such, but are the bulls preparing for an upside break?
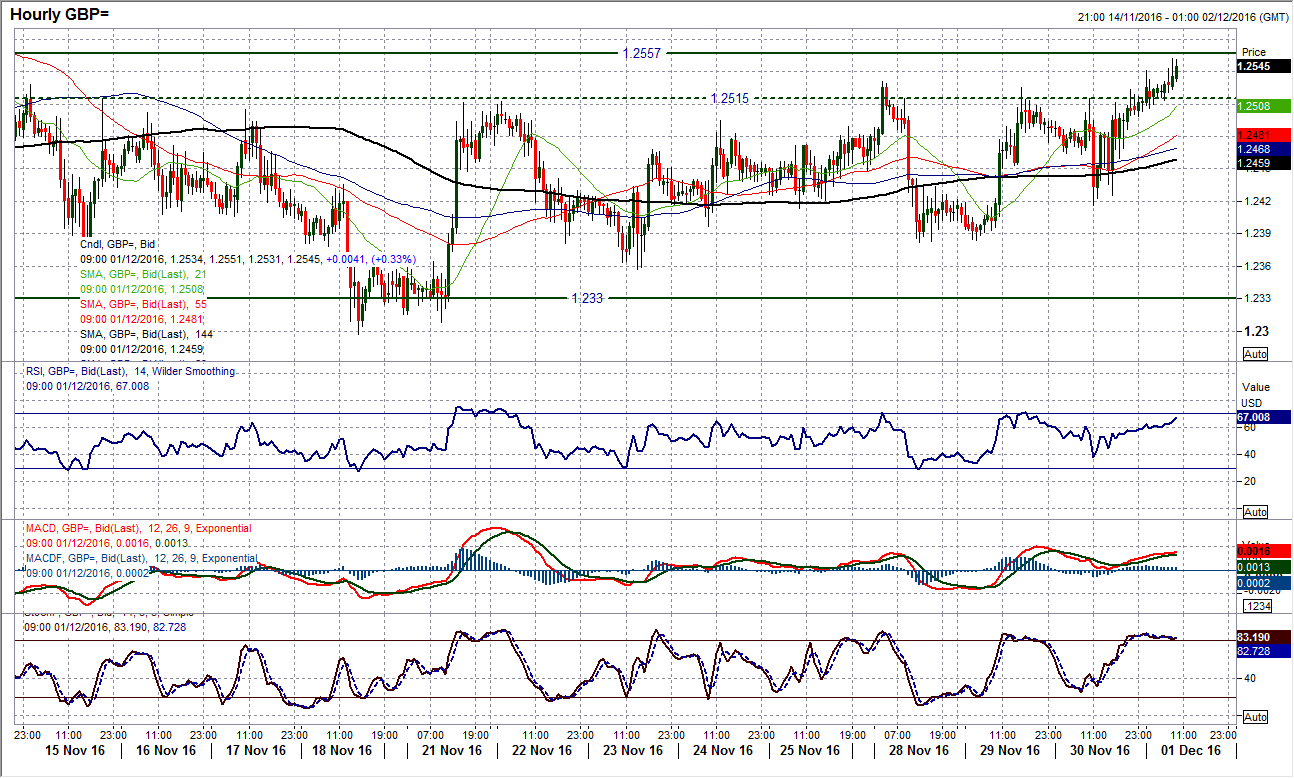
GBP/USD
Aside from one corrective candle on Monday, the bulls have been gradually improving their position in the past couple of weeks. This has allowed the market to push above the falling 55 day moving average (currently $1.2513) for the first time since mid-September. Also the momentum indicators are now starting to gain traction to the upside, with the Stochastics especially notable in their improvement. I have been talking about the resistance band $1.2515/$1.2530 which has been holding back the rallies in the past few weeks, but with early gains today the market is driving an intraday move through the resistance. We now need a confirmation closing breakout and then the bulls can begin to look higher at the resistance at $1.2557 but more importantly the November high at $1.2673. In the past week, the bulls have been steadily building a series of higher lows again with yesterday’s low at $1.2416 now a key near term support. Corrections are being bought into and the outlook is now improving again.
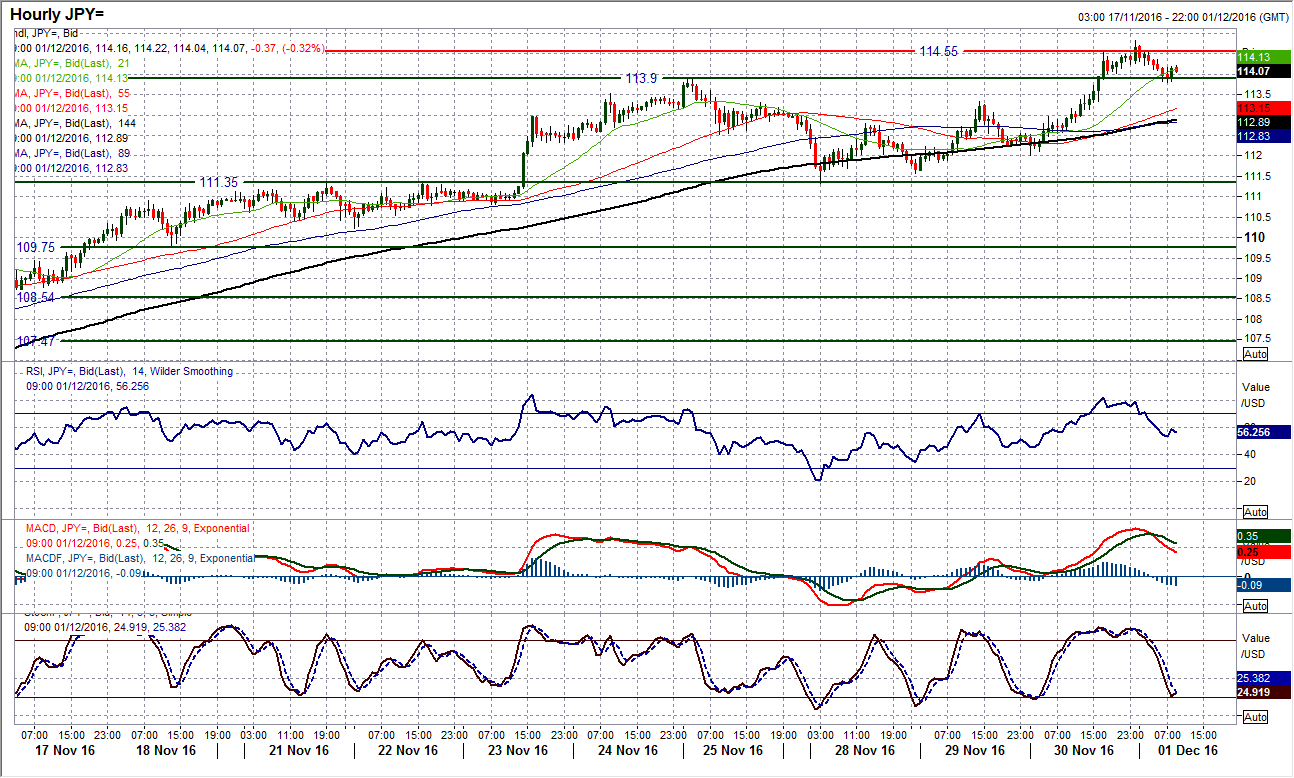
USD/JPY
After a few days of consolidation the market has stormed higher once more with the dollar bulls back in control. Yesterday’s bull candle that added over 200 pips was the strongest bull candle since 11th July, which is remarkable considering the incredible run higher of the past month. The move has also in the early move this morning, pushed higher through the 114.55 resistance of the March high. Momentum indicators remains strongly configured, although if there was a slight caveat it would be that the momentum is beginning to look a bit tired. The hourly chart shows a retreat back to the latest breakout at 113.90 overnight and it will be interesting to see if this is used as a basis of support, as all the previous breakouts have (at 111.35 and 109.75). There is a band of near term support at 113.30/113.90 that I will now be watching. The hourly momentum is unwinding with this move. The history of this bull run higher tells us we should continue to back the bulls and that corrections are a chance to buy. Support at 111.35 is increasingly key.
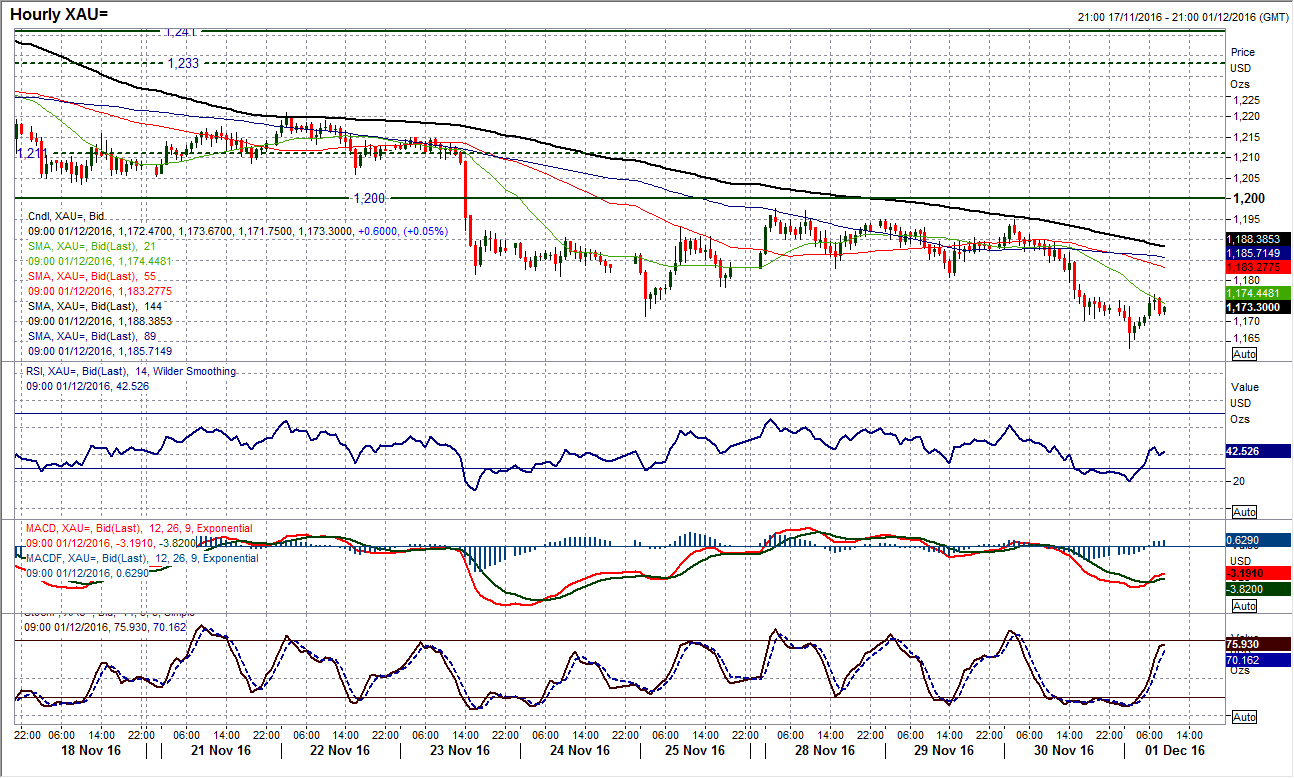
Gold
The trend is your friend on gold, and the trend is going lower. After a few days of consolidation the selling pressure renewed yesterday and the latest downside break continued the decline. This is a chart where momentum remains incredibly negative in configuration with little real sign of anything other than using the rallies as a chance to sell. The early downside move in the Asian session has seen a drop to $1163.50 before a minor rebound. However this is not a rebound to be bought into. The hourly chart shows immediate overhead supply now between $1171/$1181 and as hourly indicators unwind this will be seen as a near term sell zone today. There is little reason not to expect further weakness in due course. More considerable resistance comes in at $1197 and the long term overhead supply around $1200. There is some historic support around $1160 and $1128 but whether this will be enough to prevent further decline is another matter.
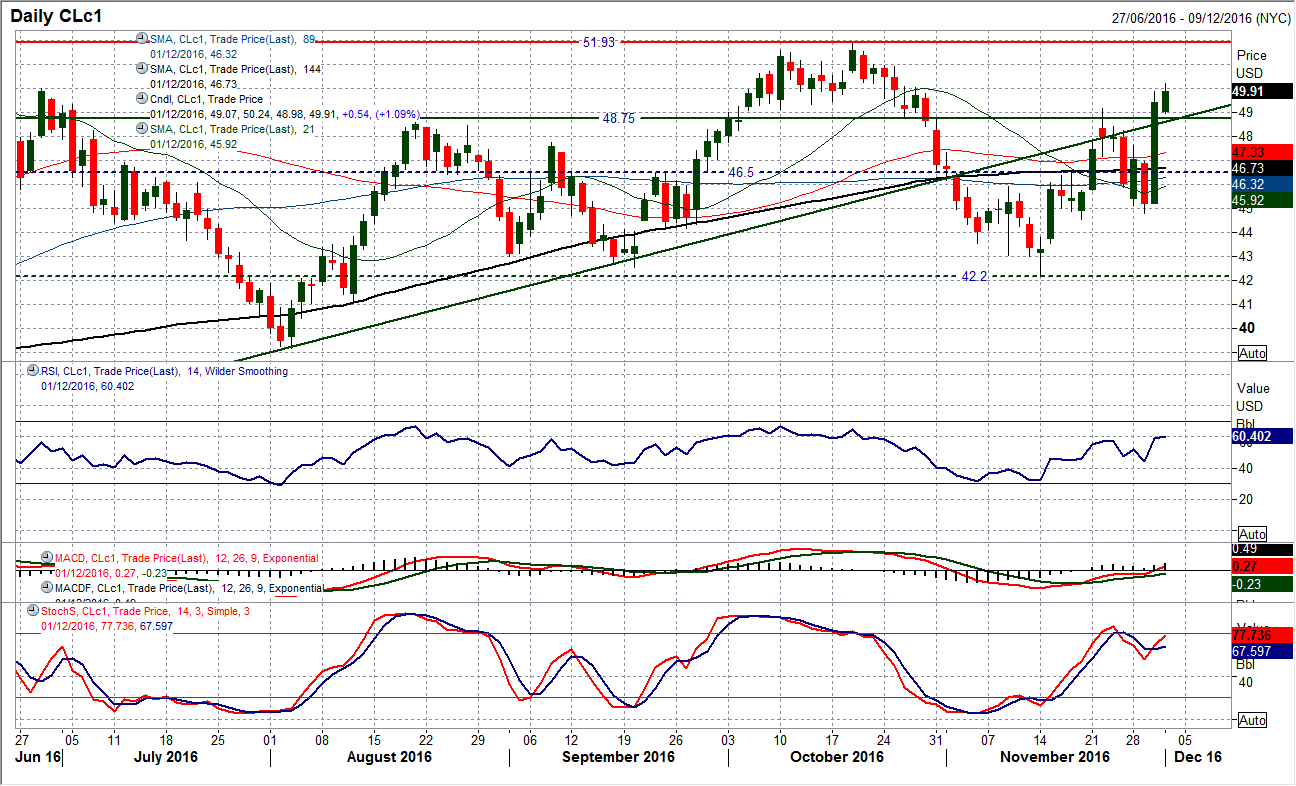
WTI Oil
The market was fixated on the OPEC decision on a potential production cut yesterday and it would certainly appear that traders liked what they heard. There was a huge rally of around 9% on oil with a big bull candle that has burst through the resistance of the previous November high at $49.20. With additional gains today the next move is a sustained push above $50.00. The way would then be open for a test of the $51.93 key October high. The key test of sentiment after such a bull candle comes in the next day when the dust begins to settle. If the bulls are happy to hold the gains then the outlook is certainly positive, and currently the signs are good. Technically the momentum is strong and there is room for further upside potential. The hourly chart shows a band of support now at the old resistance $48.75/$49.20 and this will be seen as a key area today if the price begins to unwind.
Author

Richard Perry
Independent Analyst


