Markets advance on stimulus news [Video]
![Markets advance on stimulus news [Video]](https://editorial.fxstreet.com/images/Markets/Currencies/Majors/DollarIndex/portraits-of-u-s-presidents-on-dollar-bills-gm465128326-59608952_XtraLarge.jpg)
US Dollar: June USD is Up at 99.655.
Energies: April'20 Crude Up at 22.89.
Financials: The June'20 30 year bond is Up 15 ticks and trading at 178.19.
Indices: The March S&P 500 emini ES contract is 200 ticks Lower and trading at 2558.00.
Gold: The April '20 Gold contract is trading Down at 1628.20. Gold is 230 ticks Lower than its close.
Initial Conclusion
This is not a correlated market. The dollar is Up+ and Crude is Up+ which is not normal and the 30 year Bond is trading Higher. The Financials should always correlate with the US dollar such that if the dollar is lower then bonds should follow and vice-versa. The S&P is Lower and Crude is trading Higher which is correlated. Gold is trading Lower which is correlated with the US dollar trading Up. I tend to believe that Gold has an inverse relationship with the US Dollar as when the US Dollar is down, Gold tends to rise in value and vice-versa. Think of it as a seesaw, when one is up the other should be down. I point this out to you to make you aware that when we don't have a correlated market, it means something is wrong. As traders you need to be aware of this and proceed with your eyes wide open.
At this time all of Asia is trading Higher with the exception of the Indian Sensex exchange which is Lower at this time. Conversely all of Europe is trading Lower.
Possible Challenges To Traders Today:
-
Core PCE Price Index is out at 8:30 AM. This is Major.
-
Personal Income is out at 8:30 AM EST. This is Major.
-
Personal Spending is out at 8:30 AM EST. This is Major.
-
Revised UoM Consumer Sentiment is out at 10 AM EST. This is not Major.
-
Revised UoM Inflation Expectations is out at 10 AM EST. This is not Major.
Treasuries
We've elected to switch gears a bit and show correlation between the 30 year bond (ZB) and The S&P futures contract. The S&P contract is the Standard and Poor's and the purpose is to show reverse correlation between the two instruments. Remember it's liken to a seesaw, when up goes up the other should go down and vice versa.
Yesterday the ZB made a move at around 8 AM EST. The ZB hit a High at around that time and the S&P moved Higher. If you look at the charts below ZB gave a signal at around 8 AM and the S&P moved Higher at around the same time. Look at the charts below and you'll see a pattern for both assets. ZB hit a High at around 8 AM EST and the S&P was moving Higher shortly thereafter. These charts represent the newest version of MultiCharts and I've changed the timeframe to a 15 minute chart to display better. This represented a Shorting opportunity on the 30 year bond, as a trader you could have netted 60 plus ticks per contract on this trade. Each tick is worth $31.25. Please note: the front month for the ZB is now June '20. The S&P contract is now June '20 as well. I've changed the format to Renko bars such that it may be more apparent and visible.
Charts Courtesy of MultiCharts built on an AMP platform
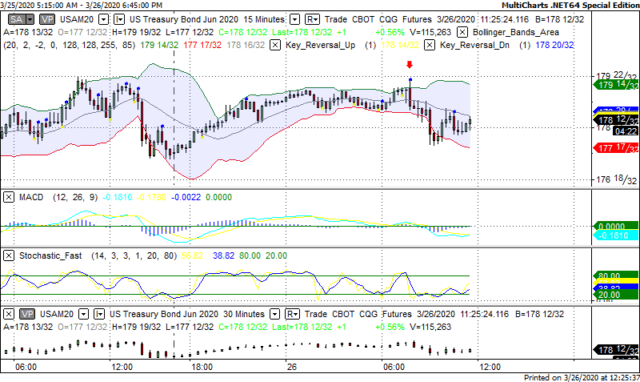
ZB - June, 2020 - 3/26/20
-637209011146012503.png)
SP June 2020 - 3/26/20
Bias
Yesterday we gave the markets a Neutral bias as we didn't see much evidence of correlation. The Dow rose 1,352 points and the other indices gained ground as well. Today we aren't dealing with a correlated market and our bias is to the Downside.
Could this change? Of Course. Remember anything can happen in a volatile market.
Commentary
Yesterday it was revealed that first time weekly unemployment claims came in at over 3 million in one week's time die to the coronavirus situation. This is the biggest first time leap in initial claims ever. The markets however rose based on the news that the proposed economic stimulus package had passed the US Senate and is now awaiting approval from the House of Representatives prior to approval by President Trump. The Speaker of the House Nancy Pelosi has claimed that it will be put to a vote this morning.
Author

Nick Mastrandrea
Market Tea Leaves


