Markets advance despite [Video]
![Markets advance despite [Video]](https://editorial.fxstreet.com/images/TechnicalAnalysis/Intermarket/Correlation/it-must-work-gm537868515-58464346_XtraLarge.jpg)
US Dollar: Dec '21 USD is Up at 93.845.
Energies: Dec '21 Crude is Down at 81.47.
Financials: The Dec '21 30 Year bond is Down 8 ticks and trading at 158.01.
Indices: The Dec '21 S&P 500 emini ES contract is 1 tick Lower and trading at 4511.00.
Gold: The Dec'21 Gold contract is trading Up at 1779.00. Gold is 80 ticks Higher than its close.
Initial conclusion
This is not a correlated market. The dollar is Up and Crude is Down which is normal but the 30 year Bond is trading Lower. The Financials should always correlate with the US dollar such that if the dollar is lower then bonds should follow and vice-versa. The S&P is Lower and Crude is trading Lower which is not correlated. Gold is trading Higher which is not correlated with the US dollar trading Up. I tend to believe that Gold has an inverse relationship with the US Dollar as when the US Dollar is down, Gold tends to rise in value and vice-versa. Think of it as a seesaw, when one is up the other should be down. I point this out to you to make you aware that when we don't have a correlated market, it means something is wrong. As traders you need to be aware of this and proceed with your eyes wide open. Currently Asia is trading Mixed. Europe is trading Mixed as well.
Possible challenges to traders today
-
Crude Oil Inventories is out at 10:30 AM EST. This is Major.
-
FOMC Member Evans Speaks at 12 Noon EST. This is Major.
-
FOMC Member Quarles Speaks at 1 PM EST. This is Major.
-
Beige Book is out at 2 PM EST. This is Major.
-
Federal Budget Balance. This is Major.
Treasuries
Traders please note that we've changed the Bond instrument from the 30 year (ZB) to the 10 year (ZN). They work exactly the same.
We've elected to switch gears a bit and show correlation between the 10 year bond (ZN) and The S&P futures contract. The S&P contract is the Standard and Poor's and the purpose is to show reverse correlation between the two instruments. Remember it's liken to a seesaw, when up goes up the other should go down and vice versa.
Yesterday the ZN made it's move at around 10 AM EST. The ZN hit a High at around that time and the S&P moved Higher. If you look at the charts below ZN gave a signal at around 10 AM EST and the S&P moved Higher at around the same time. Look at the charts below and you'll see a pattern for both assets. ZN hit a High at around 10 AM EST and the S&P was moving Higher shortly thereafter. These charts represent the newest version of MultiCharts and I've changed the timeframe to a 15 minute chart to display better. This represented a Shorting opportunity on the 10 year note, as a trader you could have netted about 15 ticks per contract on this trade. Each tick is worth $15.625. Please note: the front month for the ZN is now Dec '21. The S&P contract is now Dec '21 as well. I've changed the format to Renko bars such that it may be more apparent and visible.
Charts Courtesy of MultiCharts built on an AMP platform
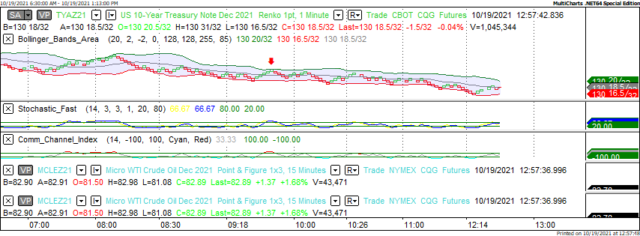
ZN - Dec 2021 - 10/19/21
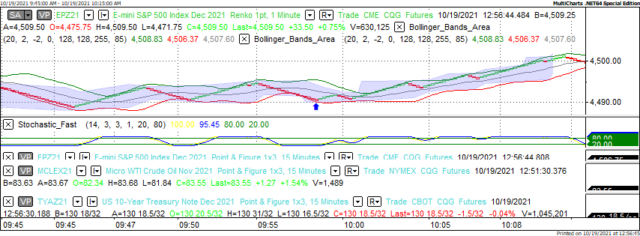
S&P - Dec 2021 - 10/19/21
Bias
Yesterday we gave the markets an Upside bias as the USD and the Bonds were trading Lower Tuesday morning. The markets didn't disappoint as the Dow traded 199 points Higher and the other indices gained ground as well. Today we aren't dealing with a correlated market and our bias is Neutral.
Could this change? Of Course. Remember anything can happen in a volatile market.
Commentary
Yesterday we had real estate related economic news in terms of Build Permits and Housing Starts. Unfortunately both those numbers did not meet expectation yet the markets advanced nonetheless. One theory is the Smart Money wanted the markets to go Higher as they recognize Market Correlation trends as well and capitalize on them. As proof of this concept below you will see a link for an interview conducted by myself and a floor trader on the exchange. He attests to the fact that institutionals do use market correlation techniques. The adage of when something is up then something else must be down hasn't escaped these folks. I hope you enjoy the talk if you listen.
Author

Nick Mastrandrea
Market Tea Leaves


