Markets Adamant
Good Morning Traders,
As of this writing 4:20 AM EST, here’s what we see:
US Dollar: Mar. USD is Up at 101.350.
Energies: March Crude is Up at 54.26.
Financials: The Mar 30 year bond is Down 9 ticks and trading at 150.31.
Indices: The March S&P 500 emini ES contract is 12 ticks Higher and trading at 2351.00.
Gold: The April gold contract is trading Down at 1231.50. Gold is 76 ticks Lower than its close.
Initial Conclusion
This is not a correlated market. The dollar is Up+ and crude is Up+ which is not normal but the 30 year bond is trading Lower. The Financials should always correlate with the US dollar such that if the dollar is lower then bonds should follow and vice-versa. The indices are Down and Crude is trading Up which is correlated. Gold is trading Down which is correlated with the US dollar trading Up. I tend to believe that Gold has an inverse relationship with the US Dollar as when the US Dollar is down, Gold tends to rise in value and vice-versa. Think of it as a seesaw, when one is up the other should be down. I point this out to you to make you aware that when we don’t have a correlated market, it means something is wrong. As traders you need to be aware of this and proceed with your eyes wide open.
Asia traded mixed with half the exchanges trading higher and the other half lower. As of this writing all of Europe is trading lower with the exception of the German Dax which is trading higher.
Possible Challenges To Traders Today
– FOMC Member Kashkari Speaks at 8:50 AM EST. This is major.
– Flash Manufacturing PMI is out at 9:45 AM EST. This is major.
– Flash Services PMI is out at 9:45 AM EST. This is major.
– FOMC Member Harker Speaks at 12 PM EST. This is major.
Treasuries
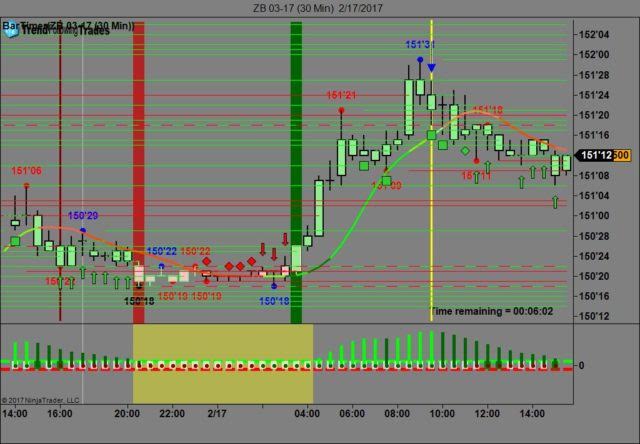
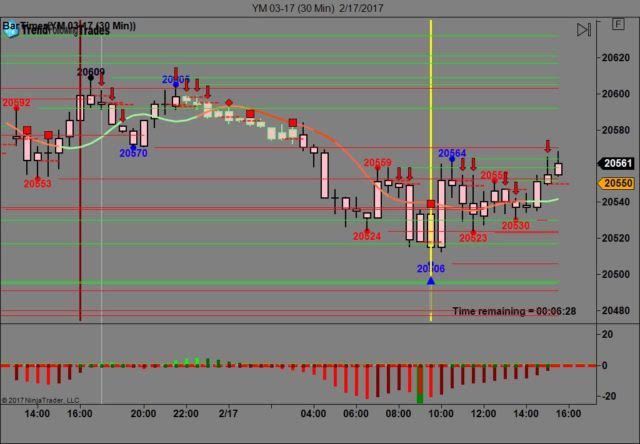
We’ve elected to switch gears a bit and show correlation between the 30 year bond (ZB) and The YM futures contract. The YM contract is the DJIA and the purpose is to show reverse correlation between the two instruments. Remember it’s liken to a seesaw, when up goes up the other should go down and vice versa.
On Friday the ZB made it’s move at around 9:30 AM EST right at the Opening Bell. The ZB hit a high at around that time and the YM hit a low. If you look at the charts below ZB gave a signal at around 9:30 AM and the YM was moving higher at the same time. Look at the charts below and you’ll see a pattern for both assets. ZB hit a high at around 9:30 AM EST and the YM hit a low. These charts represent the newest version of Trend Following Trades and I’ve changed the timeframe to a 30 minute chart to display better. This represented a shorting opportunity on the 30 year bond, as a trader you could have netted about 30 plus ticks per contract on this trade. Each tick is worth $31.25. We added a Donchian Channel to the charts to show the signals more clearly.
Charts Courtesy of Trend Following Trades built on a NinjaTrader platform.
Bias
On Friday we gave the markets a downside bias as both the USD and the Bonds were trading higher and this usually results in the indices trading lower. The Dow was trading lower pretty much all session long until the last 10 minutes or so. The Dow traded up by 4 points and the other indices lost ground as well. Today we aren’t dealing with a correlated market and our bias is to the upside.
Could this change? Of Course. Remember anything can happen in a volatile market.
Commentary
It seems that this market is adamant about thing: trading to a higher high and not closing into negative territory. Friday was the second day in a row where the Dow traded lower all session long (as predicted) but in the last 10 minutes or so jumped up into positive territory. Why is this? Wall Street is adamant about teh market closing into higher highs. Why? They’re all waiting to see what Trump’s proposed tax plan will be and looks like. In this regard they are buying into his hype. On Friday he flew into Florida on Air Force One and addresses a crowd as though he’s still in campaign mode. Apparently this seems to rejuvenate his ego as he gets pumped up by it and our new First Lady decides to open with the Lords Prayer? Don’t get me wrong I have nothing against the Lords Prayer but there is a separation between Church and State in this country, apparently he didn’t get that memo. He pumps up the crowd by introducing someone that no one had ever heard of before (thereby giving this person his 15 minutes of fame) and of course the crowd loves it. He knows how to manipulate a crowd but fails miserably when he attempts to do that with the press. Of course called them “fake news” isn’t helping his cause.
Author

Nick Mastrandrea
Market Tea Leaves


