Market Update: Bullish silver

Spot Silver (XAG/USD) 4 Hour
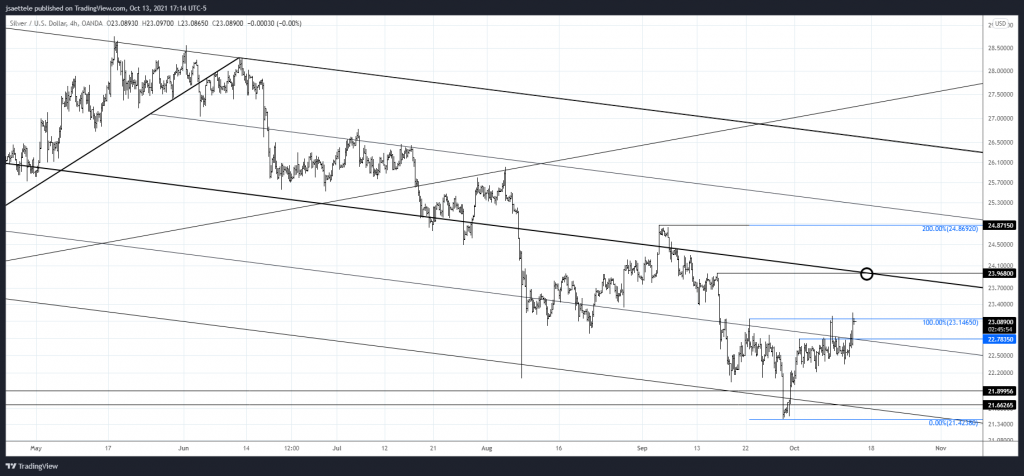
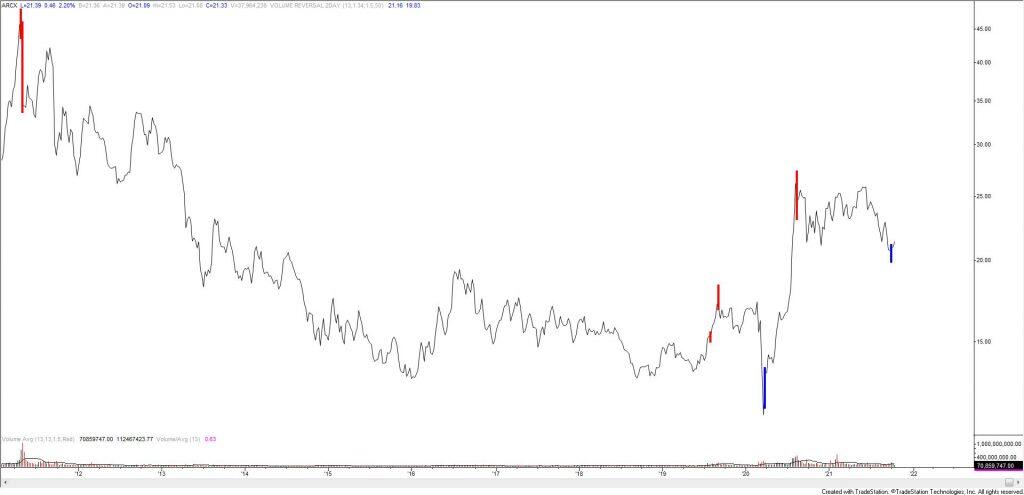
Silver has broken above and established above the 25 line so that line is now proposed support near 22.78. The inverse head and shoulders objective is 24.87, which is also the September high. 23.97 is pullback resistance. From a bigger picture perspective, SLV made a weekly volume reversal at the low 2 weeks ago (see below). Finally, silver has turned up from a 8 month channel and the bottom year+ range and sentiment is downright brutal as evidenced by articles such as EXCLUSIVE Banks prepare to scrap LME gold and silver contracts, sources say
10/6 – Silver is bullish. The rally from the low is impulsive. The question is whether or not the correction is complete. Either price pulls back to 21.90-22.10 or price breaks above the 75 line (parallel just above price) and the top side of that line then provides support. A zoomed in version and possible path is below.
SLV weekly
EUR/USD hourly
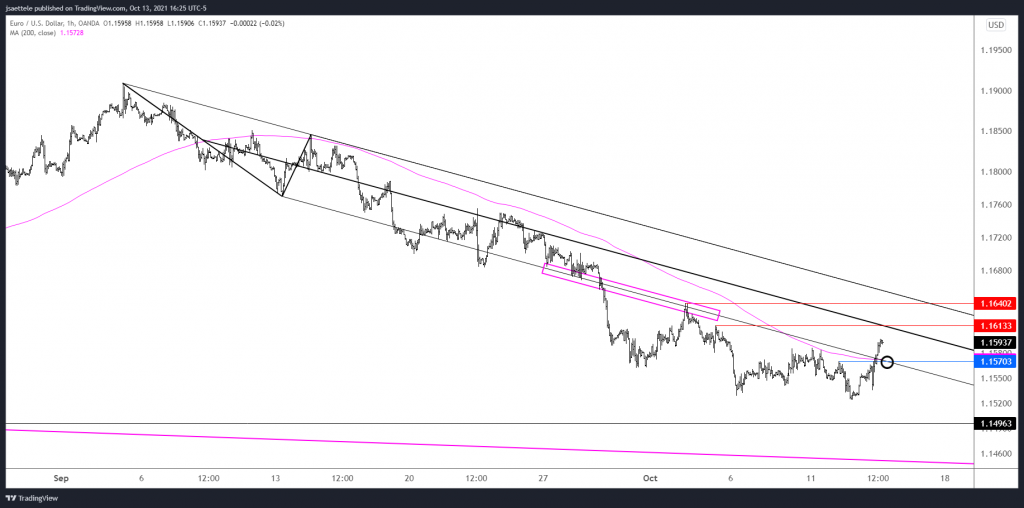
EURUSD low so far is 1.1525…good enough? As noted yesterday, USD sentiment is the exact opposite as it as early in 2021. All of a sudden, it’s popular to be a USD bull (EUR bear) which is reason enough to go the other way. Watch for support near 1.1570. 1.1640/65 is of near term interest.
10/6 – Heads up on 1.1470-1.1500 in EURUSD. This is the top side of the trendline from 2008 and March 2020 high. I’m seeing some ‘extreme language for the first time in a while regarding euro weakness (tumble for example in a headline) which suggests that sentiment is ripe for at least a snap-back rally. Again…all eyes on 1.1470-1.1500.
AUD/USD daily
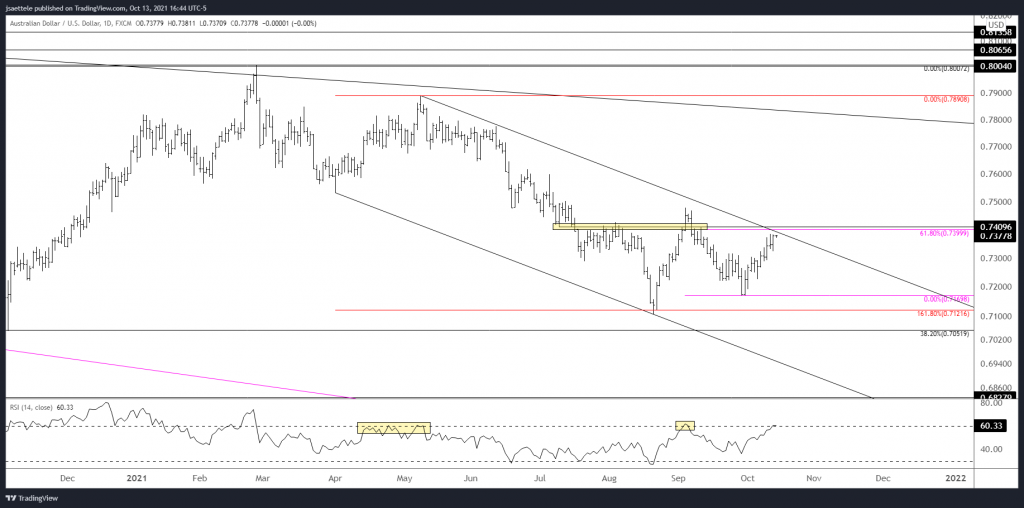
I’m torn regarding AUDUSD direction. Given my USD view (at resistance and signs of extreme bullish sentiment), it makes sense to be bullish AUDUSD. Still, pay attention to .7400/10. The level has been key since July and it’s where the rally from 9/29 would equal 61.8% of the prior leg. If action since the August low is a triangle then price likely turns down at that relationship. Also, daily RSI is back at 60. If the trend is lower/sideways then the indicator should turn down near this level. Wait and see.
USD/CAD 4 hour
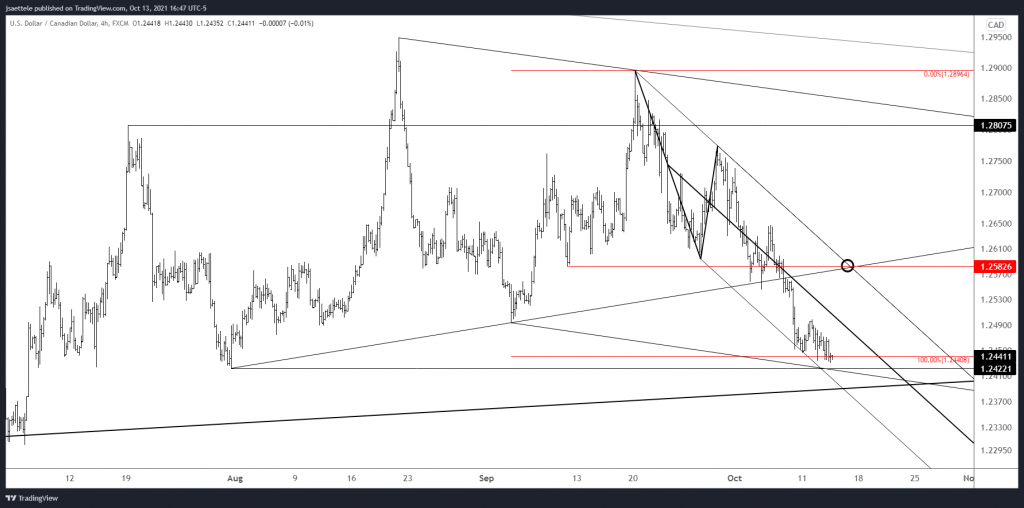
I’m thinking USDCAD bounce soon. The drop from 8/20 consists of 2 equal legs and a channel confluence rests just under the market. Also, the 7/30 low is 1.2422. If price does bounce, 1.2580 remains proposed resistance. The bigger setup here is on the downside but if we get reversal evidence down here then I’d be willing to play the bounce with a tight stop. Stay tuned!
10/11 – The break below 1.2493 eliminates the triangle scenario for USDCAD. Price has reached the bottom of a short term channel however so I’m thinking that a bounce is in order. Proposed resistance is 1.2580.
USD/TRY weekly
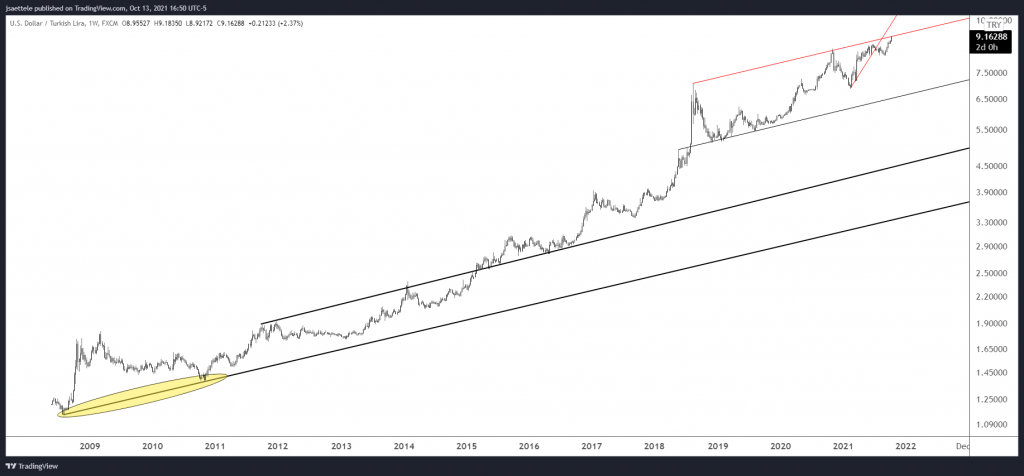
USDTRY is back to MASSIVE parallel resistance. The parallel relates to the line off of the 2008 and 2010 lows. I refer to this as the concept of ‘original slope’. Notice how extended parallels (also referred to as sliding parallels) identify pivots with precision. Maybe we get an overshoot and reversal. Regardless, I’m on reversal watch. A close up view is below.
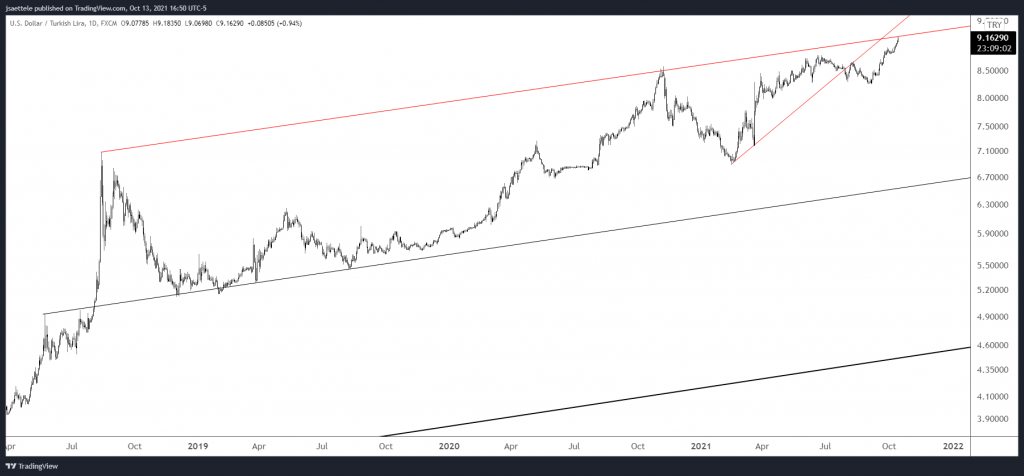
USD/TRY daily
Author

Scandinavian Markets Research Team
Scandinavian Capital Markets
Scandinavian Capital Markets' Research Team boasts world-renowned, professional market analysts and traders with proven track records in the markets and as business leaders.


