Market turning points

Current Position of the Market
SPX Long-term trend: There is some evidence that we are still in the bull market which started in 2009 and which could continue into 2021 before major cycles take over and it ends. A move up to ~4500 is possible before the current bull market makes a final top and SPX corrects into its next major cycle low due in 2023.
SPX Intermediate trend: SPX Fell short of its base projection and turned down from 4257
Analysis of the short-term trend is done daily with the help of hourly charts. They are important adjuncts to the analysis of daily and weekly charts which determine longer market trends.
Correction Starting
Cycles: Looking ahead!
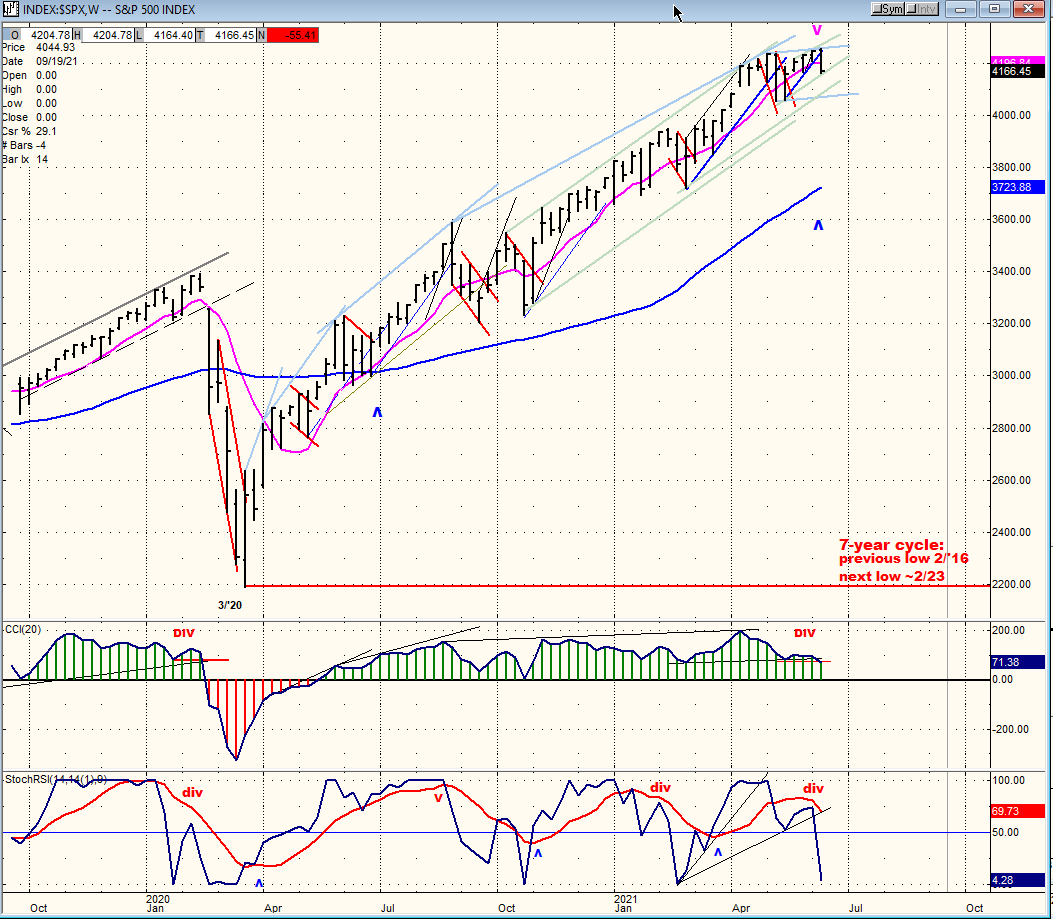
7-yr cycle – Last lows: 2009-2016. Next low: ~2023
Market Analysis (Charts, courtesy of QCharts)
WEEKLY INDICES:
SPX – DJIA – NDX
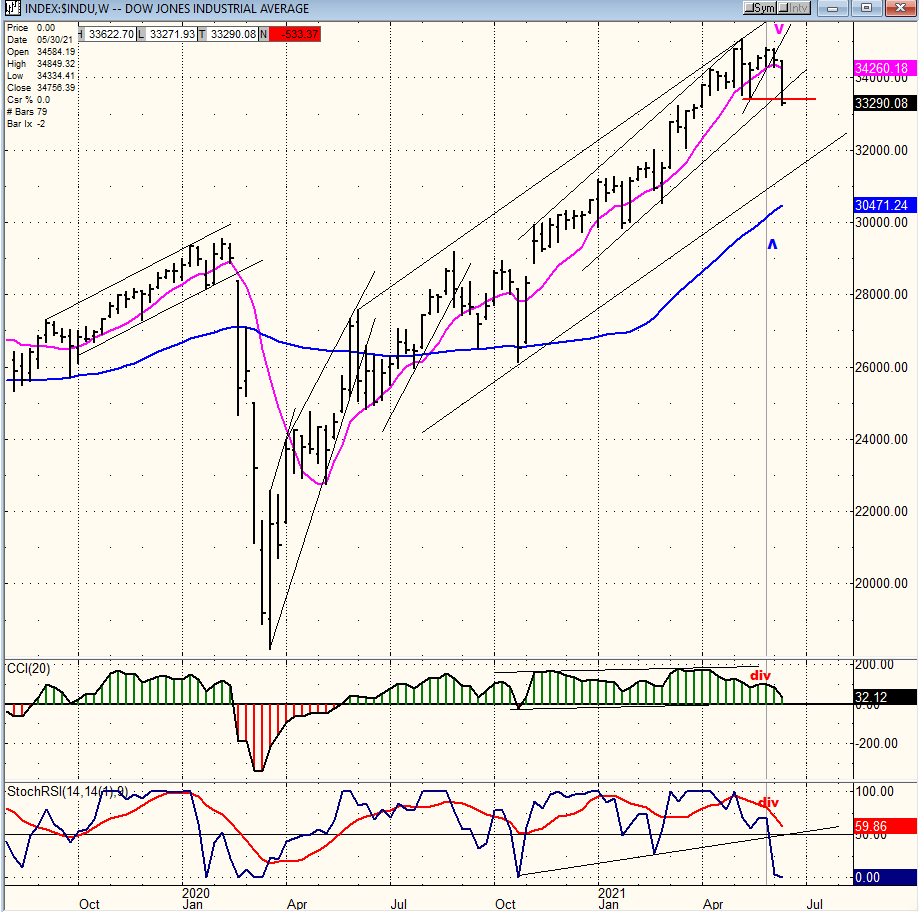
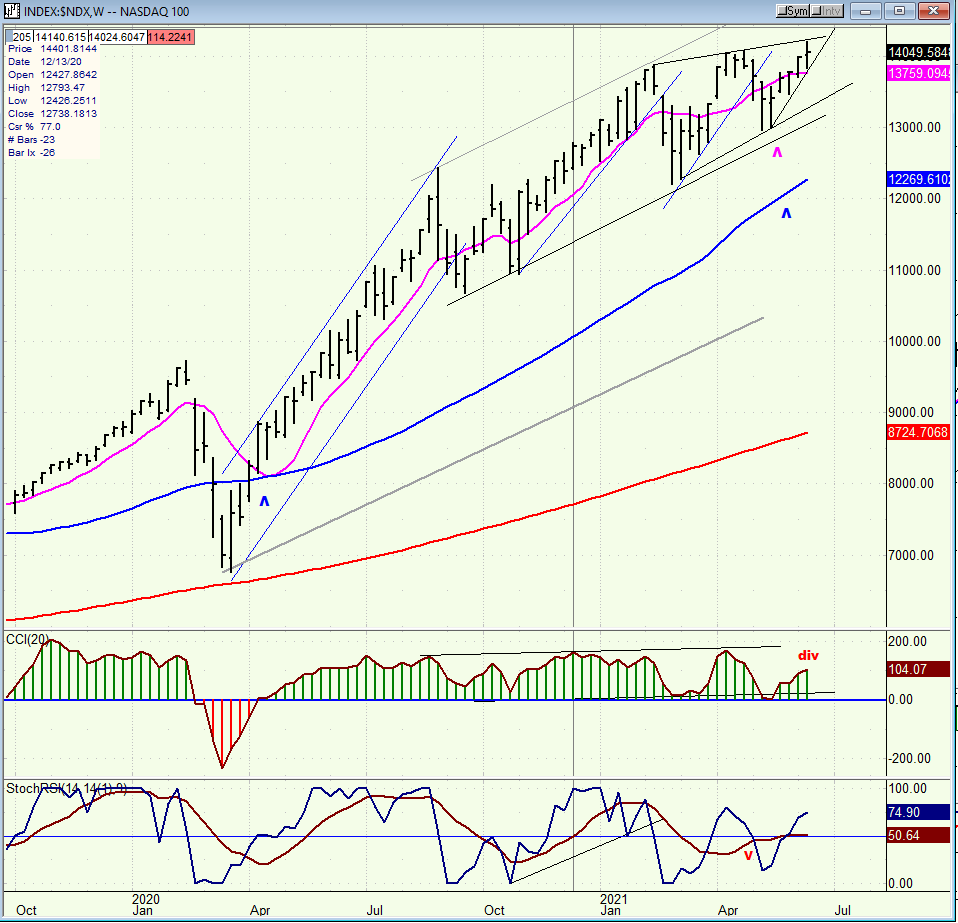
Of the three major indexes posted below the DJIA, which was the strongest, has become the weakest and has most visibly given a sell signal. The NDX, which started to decelerate before the others, has not yet reversed its trend, but it could do so as early as next week. SPX, being a hybrid of the other two, has also given a sell signal, but not as forcefully as the DJIA.
We did not need IWW to tell us that a top was being struck. INDU and SPX gave plenty of advance warning, both in their price action and in their oscillators.
We will do more fine-tuning when we analyze the SPX daily and hourly charts.
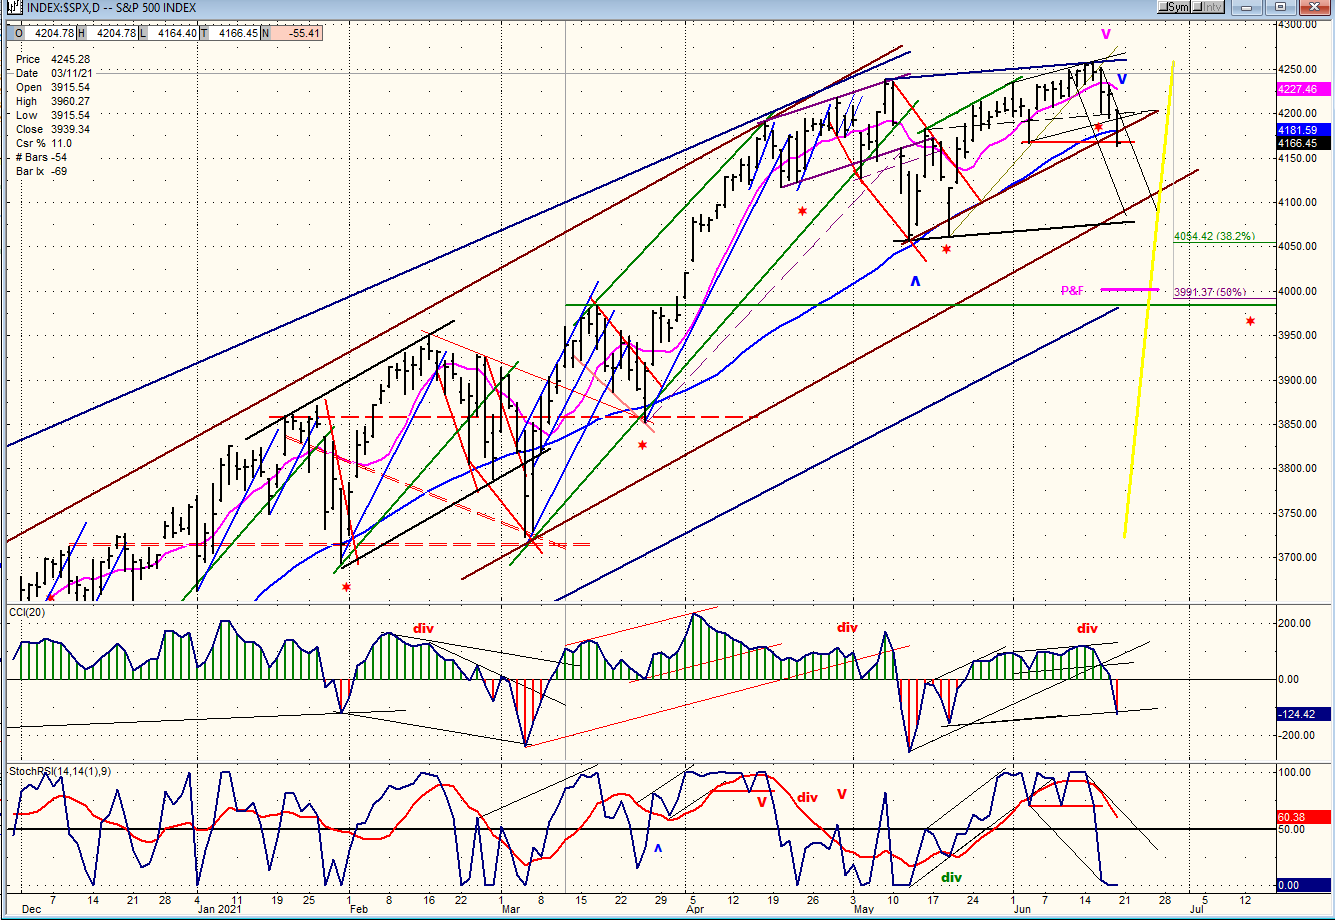
SPX daily chart
SPX has given a sell signal which is confirmed by both its indicators and its price action. The index came up just a little short of its long-term base projection to 4310, only rising to 4257 before stalling and reversing. That was the first failure at attaining forecasting perfection. The second was that after the short-term cycle finally made its low, (red asterisk) it failed to provide the expected short-term rally to retest the high before prices collapsed on Friday and continued to decline in the futures after the close.
The final price action did warn that the 4310 would most likely not be reached since during the entire week prices had difficulty making further headway -- especially after the short-term cycle made its low. IWM did put us on alert that a top was near, and the oscillators followed suit with negative divergence, all resulting in a price collapse on Friday.
So, what kind of a top is this going to be? Only a short-term top or something more? The distribution pattern over the past two weeks is projecting a P&F count down to ~3990-4010 which corresponds to a 50% retracement of the 5-wave uptrend from 3723, making this most likely the extent of the correction. As for the length of the correction, going into the second week of July sounds about right. And then what? That will depend on how much of a base we will have formed by that time, as well as the condition of the weekly indicators. Even if the correction does extend in price and time, we should keep in mind that although we fell short of the current phase projection, there is still one more potential higher count to about 4500 before the index becomes susceptible to a decline into the 7-year cycle low.
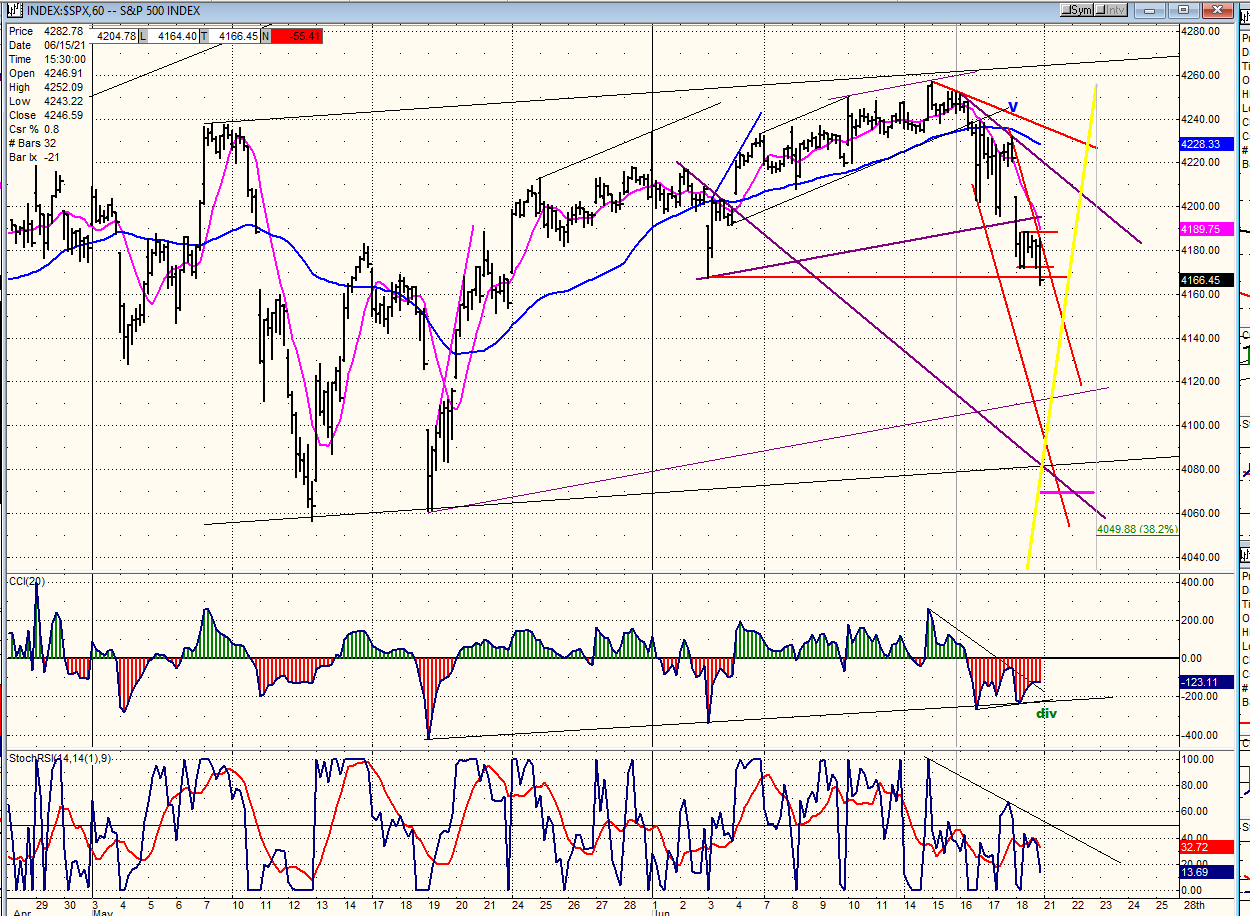
SPX hourly chart
Looking at the hourly chart, the index gapped open on Friday and, after holding for most of the day with no sign of wanting to reverse, it extended its decline in the last half-hour and closed near its low. As mentioned above, the decline continued in the futures after the close; so, it looks as if we could be heading for the horizontal pink line just above the .382 retracement level (which represents a partial P&F target) before buyers appear. This would be a good place to find temporary support from which to rebound for a day or two before dropping lower to the .50 retracement which matches the full P&F count from the top distribution pattern.
Although some positive divergence has appeared in the CCI, the index would have to remain above the red support line to suggest that a reversal was going to occur from this level, but the action into and after the close suggests the opposite instead. In any case, we need to wait and see what Monday’s action conveys. I have traced out a broad (purple) downside channel which could outline the path of the index over the next few days.
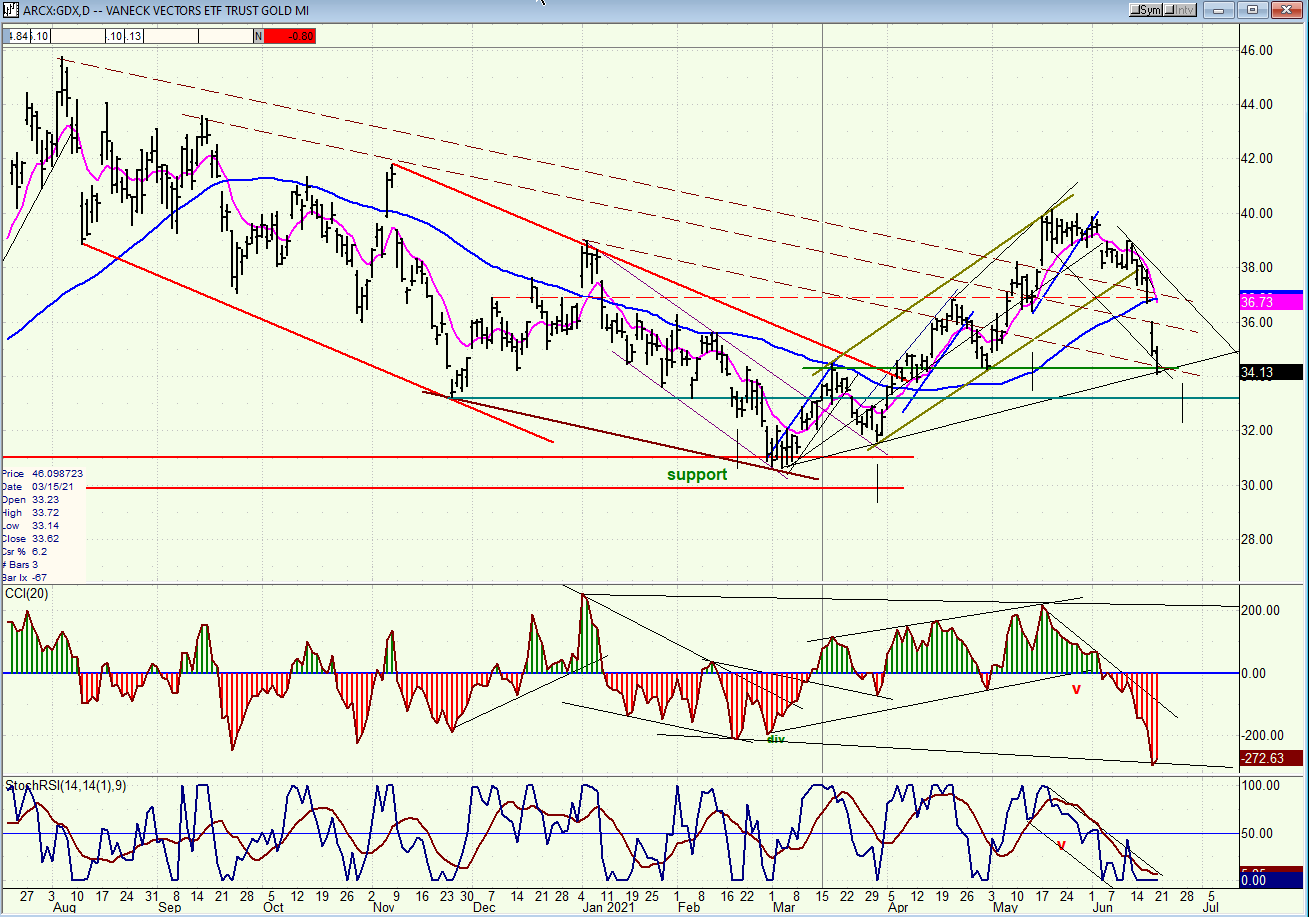
GDX (gold miners)-(dly)
GDX continued and accelerated its correction last week. It has now reached some good support which could put an end to the correction over the next few days, especially since the index may be reaching the low of a cycle which has brought about a reversal fairly regularly in the past. The ideal cycle low is marked on the chart with a small vertical line.
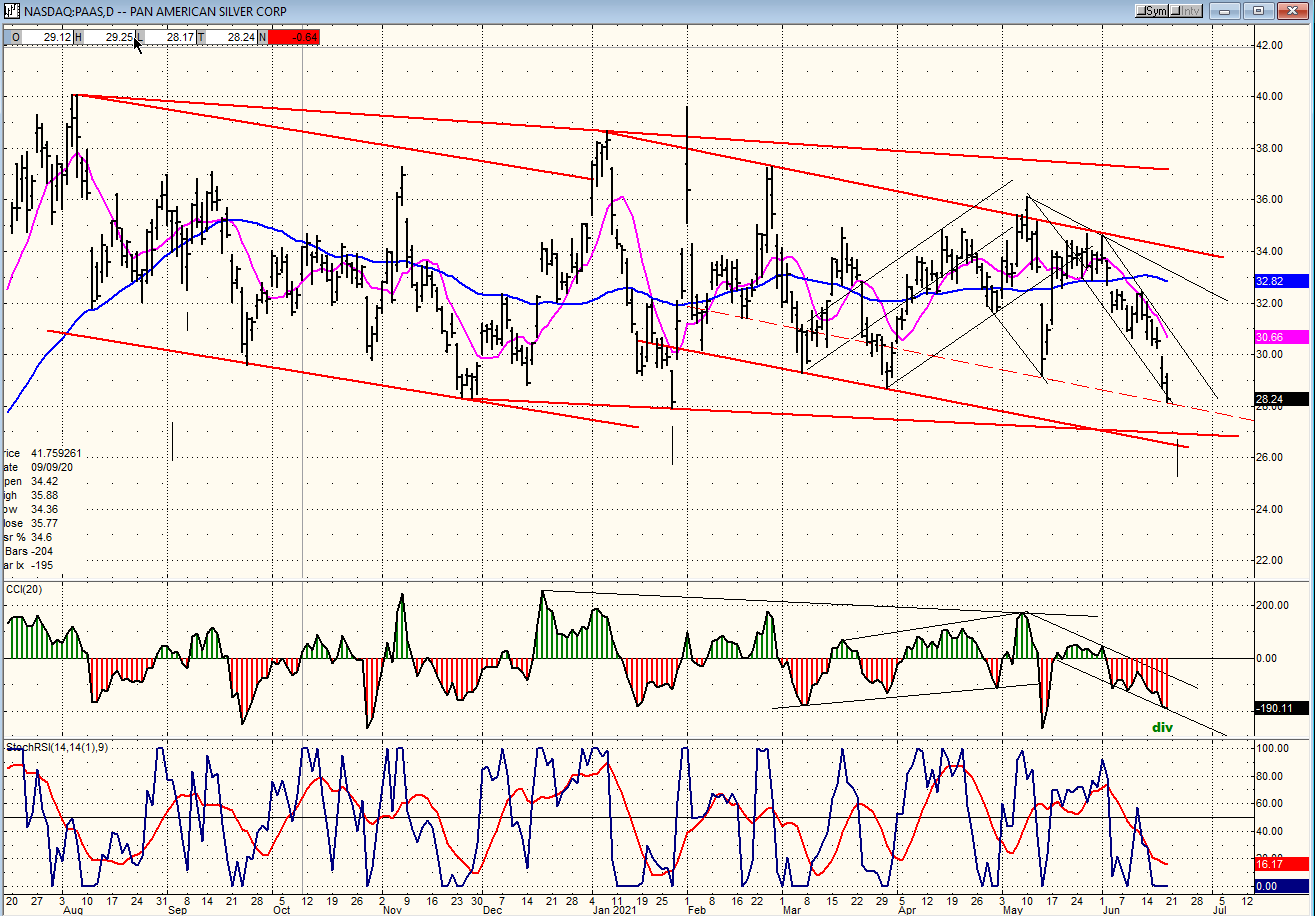
PAAS (Pan American Silver Corp-(dly)
PAAS could be influenced by a different cycle than the gold cycle, but which appears to be making its low in the same time frame. The low point is also suggested by the completion of a P&F projection in both charts.
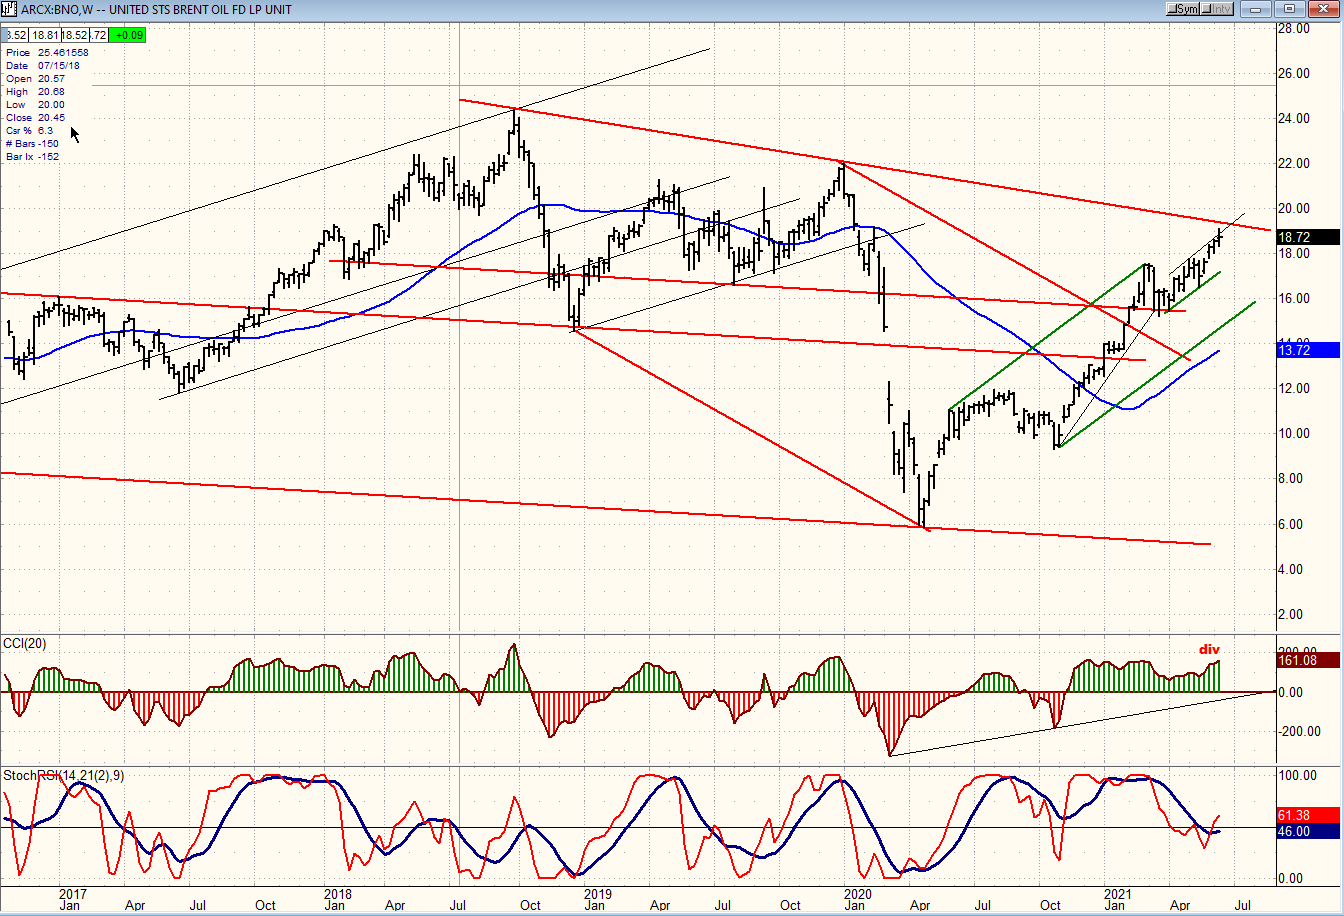
BNO (Brent oil fund) wkly
Whereby in the preceding weeks BNO closed at the top of its weekly range, this week it closed in the middle, and this suggests that it may be reaching the end of its current rally.
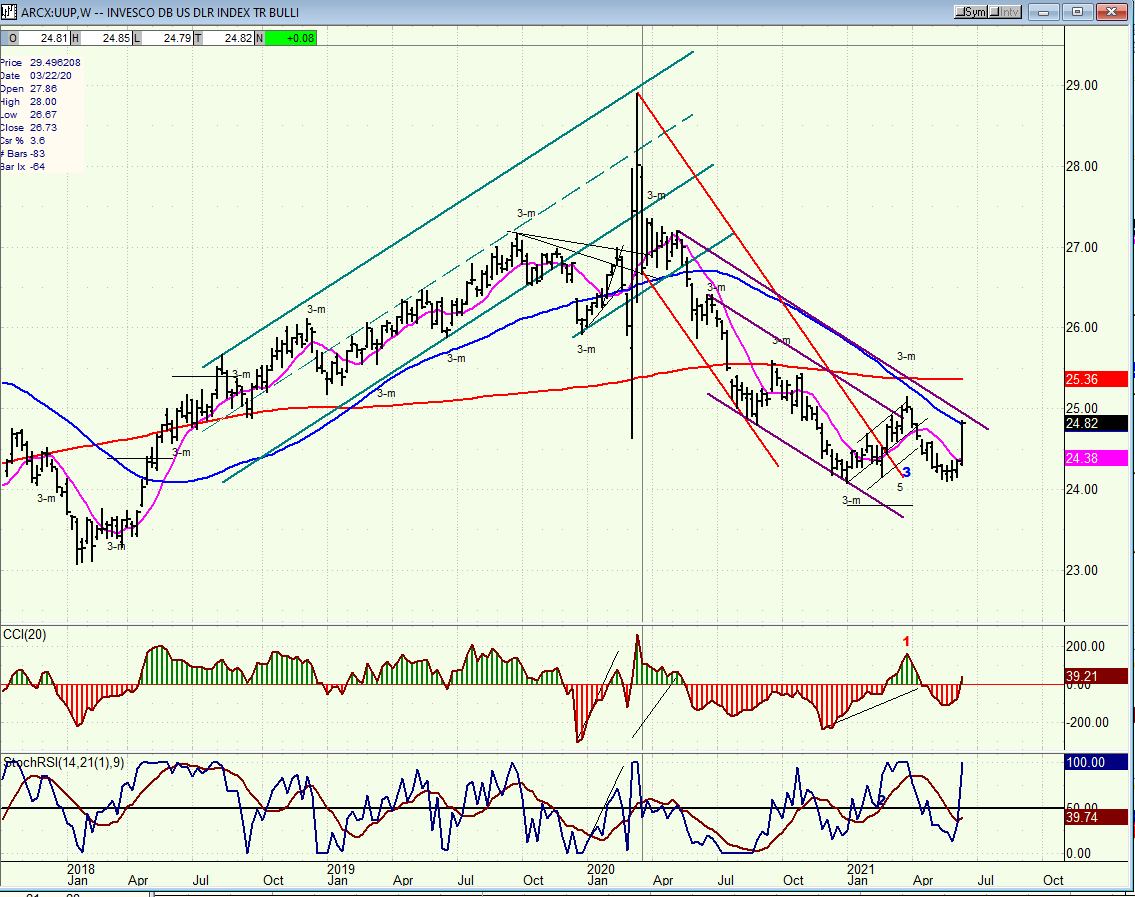
UUP (dollar ETF) (wkly) ($USD chart is not available from this data provider)
UUP showed some strength after retesting the previous low made at the end of last year. Let’s see what kind of rally iit’s capable of generating from this level.
SUMMARY
SPX was expected to conclude its uptrend from 3723 near 4310, but it fell a little short of that projection. A decline into early July should be expected.
Author

Andre Gratian
Market Turning Points
When I was a stock broker years ago, a friend introduced me to technical analysis of the market and it is not an exaggeration to say that I fell in love with this approach! Ever since then, it has become an increasingly important


