Market risk aversion settles as traders look ahead of the FOMC [Video]
![Market risk aversion settles as traders look ahead of the FOMC [Video]](https://editorial.fxstreet.com/images/TechnicalAnalysis/Sentiment/RiskAversion/businessman-23453896.jpg)
Market Overview
Is yesterday’s risk rally the start of a sustainable recovery, or just a false dawn? The Coronavirus is still spreading along projected modeling expectations, whilst the economic impact of China moving into lockdown mode in many major cities is yet to be ascertained. However, there was a risk rally yesterday as US economic data continues to hold up well (Consumer Confidence much higher than expected, along with the regional Fed survey in Richmond). This has driven a turnaround on bond yields with associated declines on the yen and gold. Equity markets have rebounded too, in a move that shows signs of solidifying today. Even oil, which has been smashed in the past couple of weeks, is starting to develop support (as the chatter is that OPEC would further curb production to account for demand declines from the Coronavirus). It is still too early to confidently suggest that risk appetite is sustainably picking up again, but at least the sell-off has been curbed for now. Markets are fairly steady today also with tonight’s Fed decision in focus. No change is expected on rates (currently until the second half of the year). Also, the new rotation of regional Fed presidents voters gives the committee a balanced and centrist bias. The one key question will be about how the Fed deals with the recent increase of the balance sheet which has been seen as quasi-QE.
Wall Street rebounded strongly last night with the SP 500 +1.0% at 3276 whilst US futures are a further +0.2% higher early today. Asian markets were mixed as Hong Kong re-opened over -2% lower after lunar new year, but the Nikkei was +0.7% higher. European markets are also meeting this rebound with early gains today (FTSE futures +0.1% and DAX Futures +0.2%). In forex, there is a mild USD positive bias across the major pairs, but also there is a degree of renewed JPY strength too. In commodities, gold is settling after yesterday’s correction whilst oil is a percent higher.
Once more there is a US bias to the economic calendar and the Fed looms large later today. US Pending Home Sales are a 1500GMT and are expected to improve by +0.5% in December (following a +1.2% improvement in November). The EIA Crude Oil Inventories at 1530GMT are expected to show +0.5m barrels of stock build (after a -0.4m barrel drawdown last week). The big attention will be on the FOMC monetary policy decision at 1900GMT. There is almost no expectation of any move on rates to the +1.50%/1.75% Fed Funds range. However, the press conference will be interesting at 1930GMT.
Chart of the Day – AUD/JPY
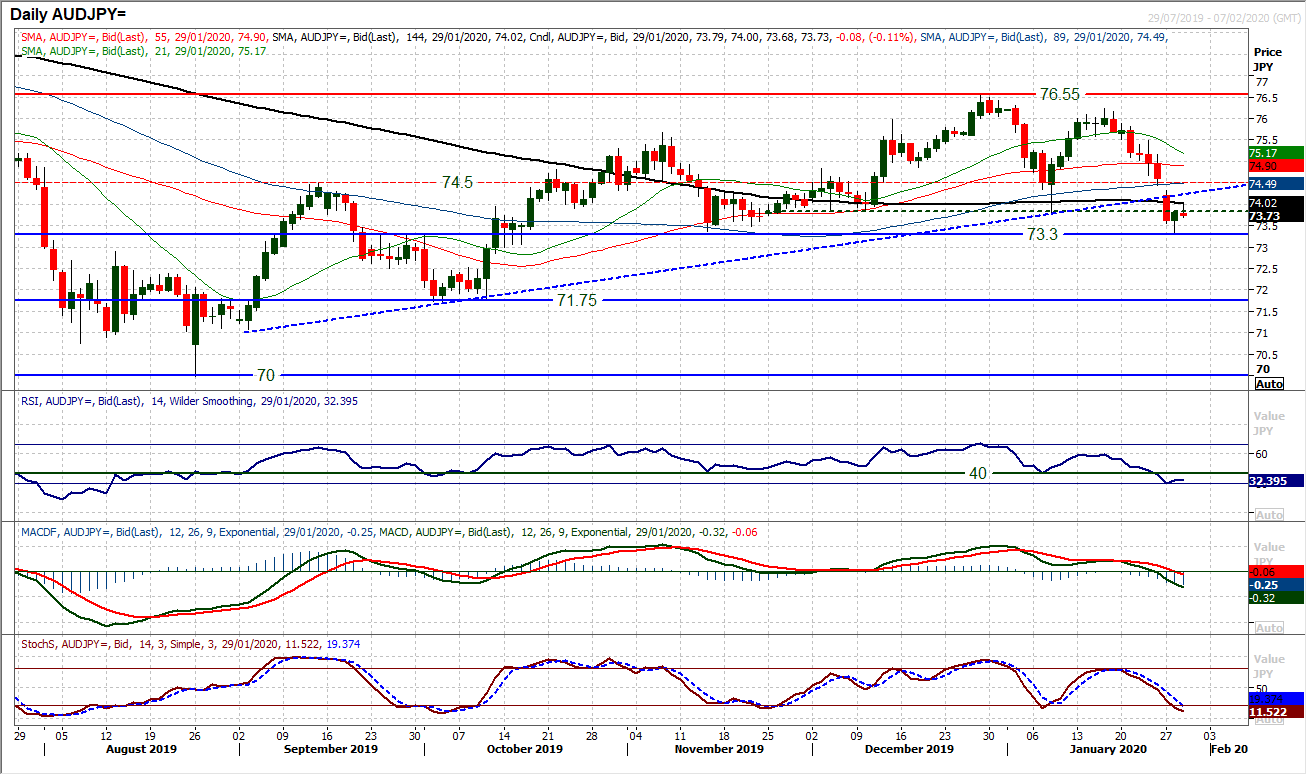
If there is a serious risk rally across markets, there will be an associated rebound on Aussie/Yen. A bull candle yesterday (effectively a bull hammer) certainly hints at a turnaround. The fact that it comes from the support of the November low around 73.30 which is an old pivot line has come not a moment too soon for the bulls. However, stepping back from the brink is one thing, for the recovery to be considered sustainable, much more needs to be done. The uptrend recovery since the August low at 70.00 has been broken and the move has left momentum in corrective medium term configuration. The RSI recently slipped to a near six month low, whilst MACD lines are now falling below neutral and Stochastics also negative. There is now a band of overhead supply between 73.85/74.50 (including the underside of the old uptrend at 74.25 today) for the bulls to overcome. There is a gap still open at 74.45 from Monday’s opening sell-off, but this band of resistance is key now. The hourly chart shows that this pick up yesterday is still within the confines of a near term technical rally and only a move above 60 would really suggest the bulls are turning a near term corner.
WTI Oil
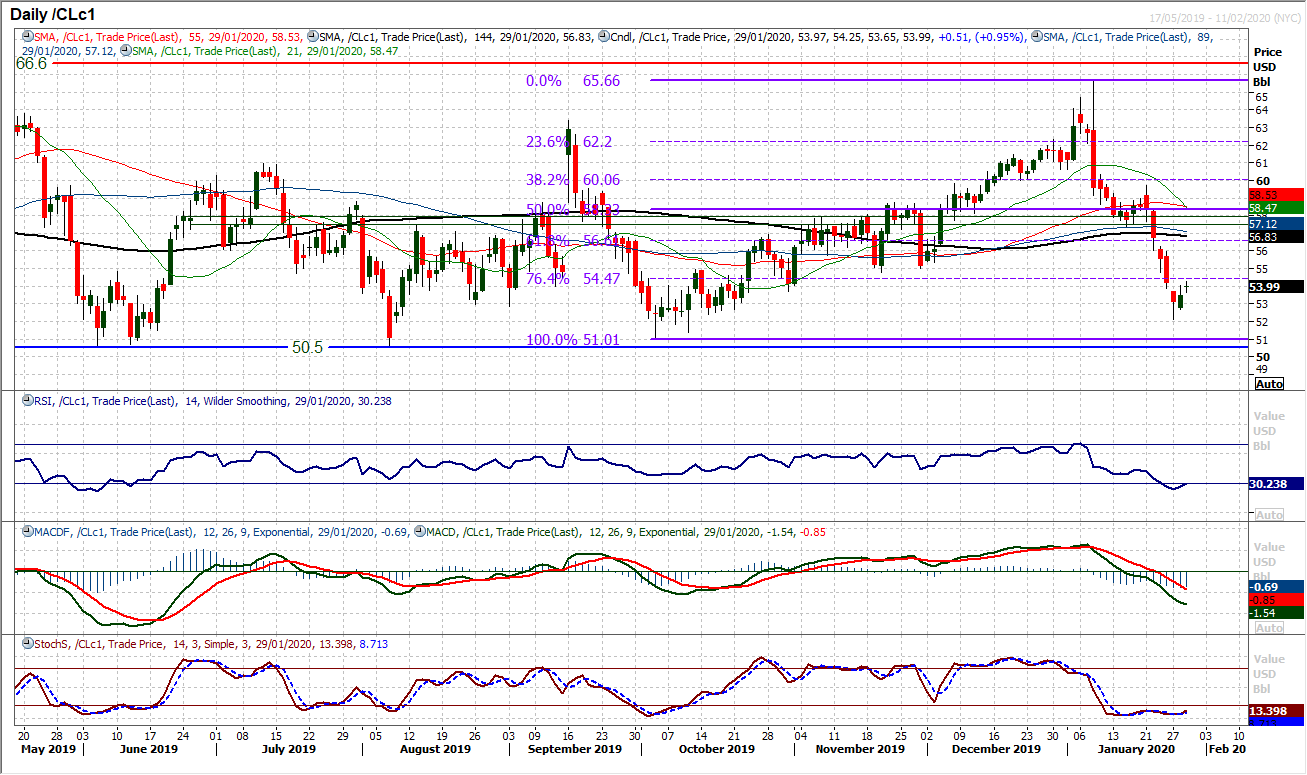
Signs of support forming for oil now. Monday’s gap could have been an “exhaustion gap” (which are typically seen at the end of a strong run) at $53.85 and having seen the gap “filled” yesterday, another positive start today raises the prospect of this gap being “closed”. A move back above the 76.4% Fibonacci retracement (of $51.00/$65.65) at $54.45 would see the bulls making good recovery progress. Already the hourly chart indicators are beginning to find a more constructive configuration (above 60 on RSI, above neutral on MACD). Resistance at $56.00 would be the next recovery resistance area. The RSI consistently holding back above 30 is also a positive sign. Support is initially at $53.60/$52.70.
Dow Jones Industrial Average
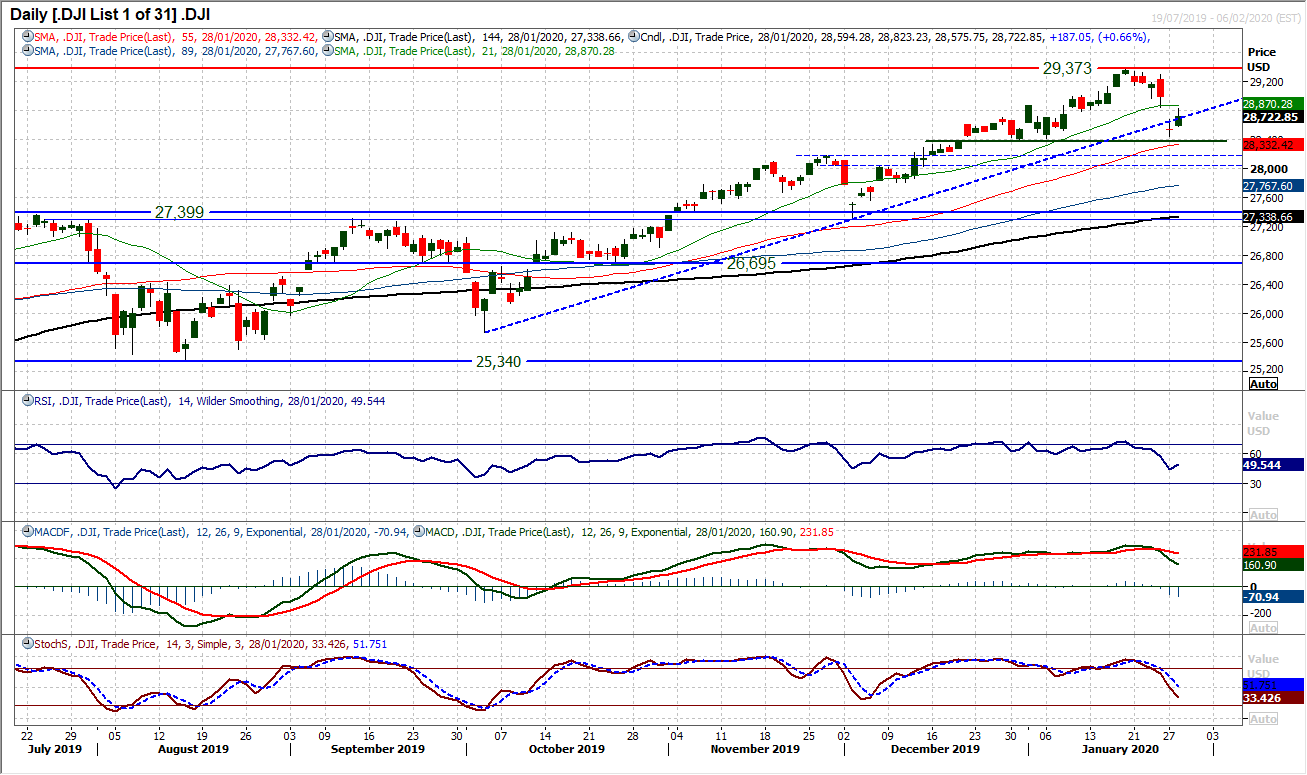
A strong rebound session has saved the Dow from breaching what would have been the first key support of a higher low at 28,376. The question is whether this is a sign that the sell-off has already played out. With a gap still open at 28,843 (the S&P 500 has filled its downside gap) it too early to say. Subsequently the response today could be more telling. There is still a corrective feel to the momentum indicators, with MACD and Stochastics sliding. The RSI is a shade under 50. So a failure to “close” the gap at 28,843 at the end of today’s session would be negative. The bulls will note how strong the support at 28,376/28,440 is now becoming. However, with a corrective configuration still on the hourly chart indicators, the bulls still have work to do to ensure the recovery is on track. A move back above 28,965 would help to confirm improvement.
Other assets insights
EURUSD Analysis: read now
GBPUSD Analysis: read now
USDJPY Analysis: read now
GOLD Analysis: read now
Author

Richard Perry
Independent Analyst
Richard Perry, Independent Market Analyst, has over 20 years of experience working in financial markets in London.


