Market Review - Point & Figure Overviewof SPX

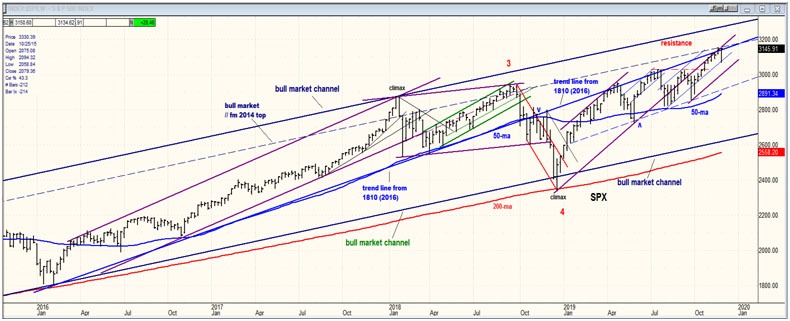
Long-term trend: The bull market which started in 03/09 shows no sign of having run its course. A rough count taken on the long-term Point & Figure chart gives us a potential target of 3680+. A few weeks ago, it was not clear if structurally, SPX would retest its 12/18 low of 2346 or even surpass it before making a new high, but recent action appears to have eliminated this possibility. In EWT parlance, this means that 2346 was most likely wave 4 of the bull market and not just wave-A of 4, and that it was also the beginning of the final wave 5 of the bull market which has higher to go before coming to an end. (no change)
Intermediate trend: Based again on the long-term P&F chart, if 3160-3180 fails to bring about an intermediate top, we could see the index run up to ~3240 after a minor correction has taken place. (no change)
Short-term trend: The 3150 short-term projection did bring about a correction which ended at 3071. The index then rallied back up to 3150 where it is currently forming a second short-term congestion top which could push a little higher to 3155-65before pulling back again.
Market Analysis (All charts are courtesy of QChart)
SPX-IWM weekly charts
SPX is at a serious resistance level on the weekly chart. Although pushing higher every week, it has not been able to get back inside the channel from the 2346 low. It has also now reached the extension of the trend line from 1810 which has stopped it on two former occasions. And finally, it has now reached a parallel of the top bull market channel line drawn from the 2014 top. It would not be surprising if the index started to hammer out an intermediate top in this area, especially since it has intermediate P&F projection targets around these levels.
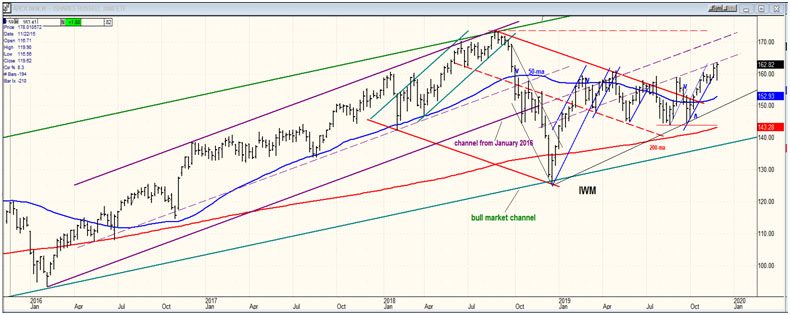
IWM is neither gaining nor losing on SPX in terms of relative strength and may continue to underperform the former for the rest of the bull market, alerting us with increased relative weakness as it approaches completion.
SPX daily chart
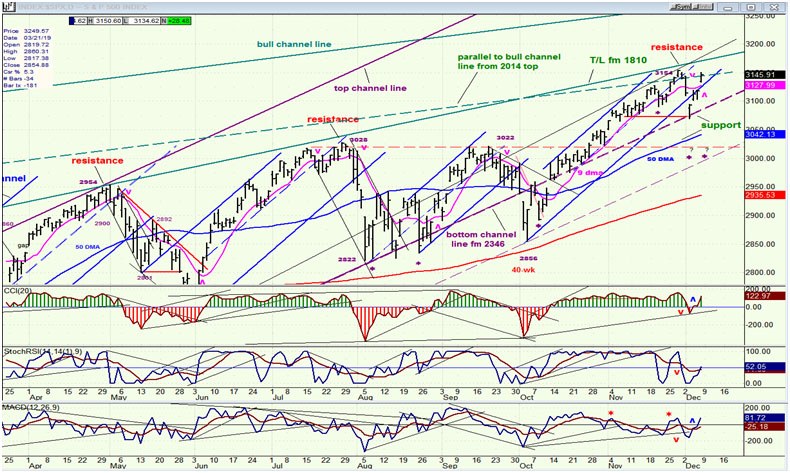
The resistance that SPX faces in this area is magnified on the daily chart. One should also note that this is the third time that the index has failed to get above the trend line from 2180. There is normally something terminal after a third failure, but if it managed to get above it decisively, this would be a show of underlying strength. We should also take into consideration the P&F projection target of 3160-80 at this level which adds to the apparent resistance, suggesting that failure will be more likely than success.
There is some support directly below this level. On this chart, it is provided by a former short-term low which stopped last week’s decline, along with the extension of the bottom daily channel line from 2346 which was breached severely by the 40-wk cycle low in October but which was also allowed to move back inside the channel by the reversal of that cycle. A little lower, there is also the 50-dma which has a history of price support and resistance. You can see this clearly if you go back to the beginning of the bull market. Since May, SPX has rotated around the 50-dma, suggesting that there is a battle being waged at the intermediate level between bulls and bears, neither able to make decisive headway. Considering the resistance discussed at the current level, one could envisaged a congestion pattern being formed in this area which would eventually give way to an intermediate decline into February- March and even Mid-2020 when more important cycles are likely to make their lows.
Speaking of cycles, a cycle low was ideally scheduled for about 12/10 which could have been cut short by good economic and other real or fake news. (It is well-known that lately, pronouncements by Trump or some of his advisors concerning the trade war with China have affected the market in both directions). If allowed to bottom on schedule, this cycle and another due about a week later could still cause a pull-back from Friday’s high.
SPX hourly chart
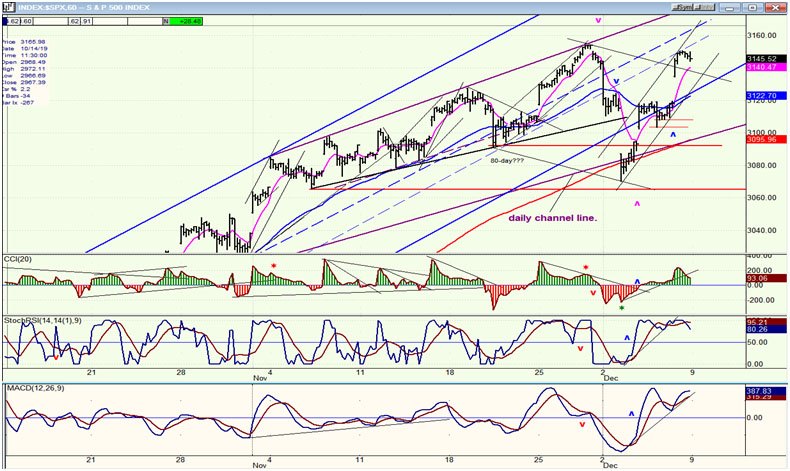
A new short-term uptrend started at 3070 after SPX found support on the lower daily channel line and formed some positive divergence in the CCI. By Friday it had nearly reached the former high of 3154 before consolidating ahead of the close in what was only a very minor pull-back, suggesting that it is not quite finished and could push to about 3155-60 before it is done.
Unless we get some exceptional strength on Monday, a positive opening should produceonly another blip upward which would create some negative divergence in the CCI -- something which is currently lacking -- to warn us that the move is coming to an end. Since therecent minor base has created a P&F count ideally to 3155-60, this is what I would expect of this move.
It is not clear if the cycle expected on ~12/10 bottomed early, or that the pull-back will be generated by another one bottoming about a week later; but either one could cause the expected retracement to obvious support just below 3120.
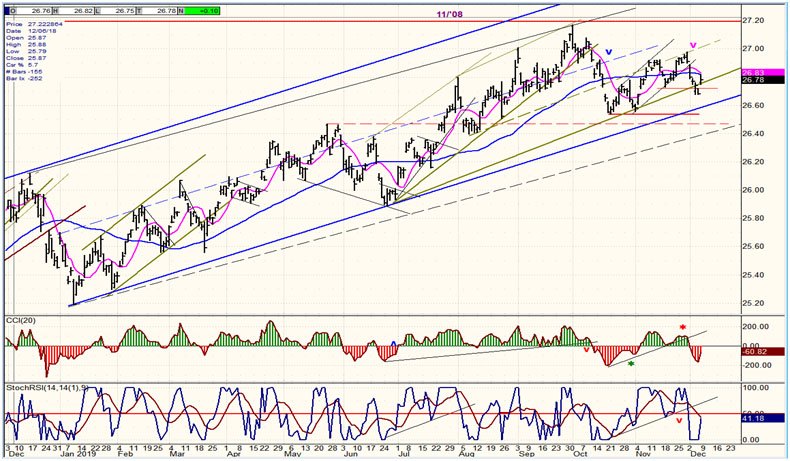
UUP (dollar ETF) daily
UUP has created a sell signal at the daily level which suggests that it could easily move through the blue channel line and down to ~26.50. Friday’s strong job report caused a rally to the daily 50-dma which stopped the advance. A move down to 26.50 would also put a “0” on my half-point P&F chart -- something that the October low failed to do by 4 cents! Either snails or sloths are writingthis chart; I’m not sure which!
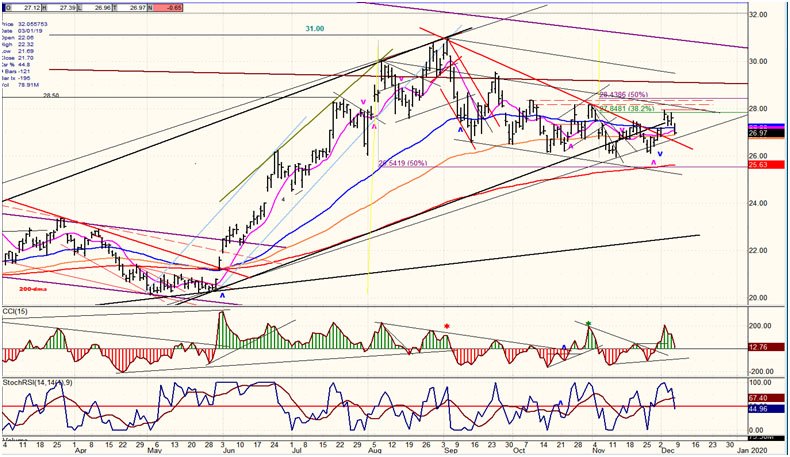
GDX (Gold miners ETF) weekly
After retracing nearly 50% of its previous uptrend, GDX has found temporary support and recovered .382 of its corrective move. Since the daily indicators have not yet given a sell signal, it may yet try to movea little higheras equities correct for a few more days. However, it is not likely to move much higher until SPX is ready to have an intermediate correction, and this will probably have to wait until early next year.
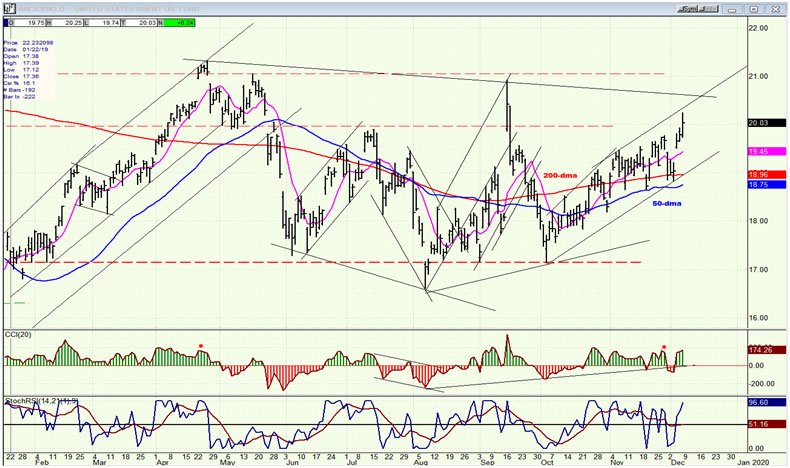
BNO (U.S. Brent oil fund) daily
After moving back above its 50-dma, BNO is following an up-trending channel which started from the October low in conjunction with the stock market. It’s very likely that it will continue to mimic the trend in SPX and reverse only when the latter is ready to do so.
Summary
The short-term correction which had been predicted in the last newsletter occurred right on cue, but failed to reach 3035 which would have been a .382 retracement of the uptrend from 2856. This suggests that that trend has not yet reversed conclusively and that new all-time highs will be seen, perhaps as soon as Monday. If not overcome decisively, the resistance area noted on the weekly chart should start to create a congestion top which will precede the next intermediate downtrend.
Author

Andre Gratian
Market Turning Points
When I was a stock broker years ago, a friend introduced me to technical analysis of the market and it is not an exaggeration to say that I fell in love with this approach! Ever since then, it has become an increasingly important


