Market insight for the final full week of January

Despite a slow start to the week, as US banks closed their doors in observance of Martin Luther King Jr. Day, there is much to consider.
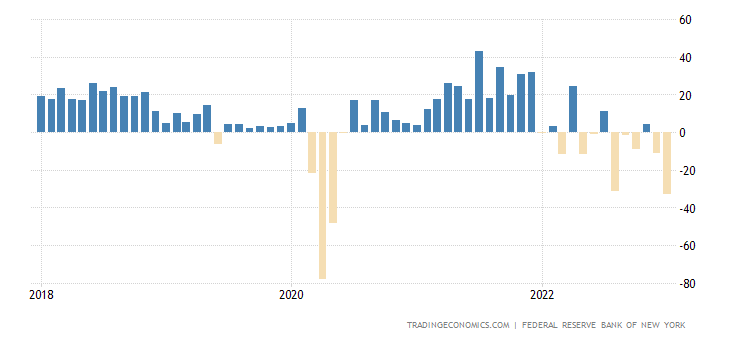
In the US, producer prices (PPI) eased in December to -0.5%, following November’s downwardly revised 0.2% figure. Retail sales also shows that US consumers tightened their purse strings in the month of December, falling -1.1% from an upwardly revised -1.0% previous. In terms of housing, the Starts measure weakened by -1.4% in December (lower than the min forecast range of 1.25%) and for building permits we realised a decline of -1.6%. Softness was seen in the Empire survey earlier in the week with the release showing its worst output since mid-2020 (chart below). However, the Philly Fed’s survey was somewhat tame, improving in January to -8.9 from -13.7 in December.
Thursday had Fed Vice chair Lael Brainard, a vocal member of the FOMC, take part in a speech at the University of Chicago Booth School of Business, Chicago, Illinois. Brainard noted that ‘even with the recent moderation, inflation remains high, and policy will need to be sufficiently restrictive for some time to make sure inflation returns to 2% on a sustained basis.’ The full speech can be found here: https://www.federalreserve.gov/newsevents/speech/brainard20230119a.htm.
Jobs data out of the UK saw the unemployment rate remain at 3.7% in November, in line with economists’ expectations and matching the previous print. Though do bear in mind that this is a lagging indicator. The UK claimant count increased by 19,700 in the 12 months to December, following November’s 16,100 rise. Another widely reported economic event last week was the UK’s latest inflation release. Consumer prices eased for a second consecutive month to 10.5% in the 12 months to December, down from November’s 10.7% print. Notably, annual inflation peaked at 11.1% in October. Also of note, the Governor of the Bank of England (BoE) was out and about last week. On an official visit to South Wales, Bailey aired a more optimistic tone for the UK economy. Although not commenting on future policy moves, he did note that the central bank believes inflation should begin to decline more rapidly in 2023 and that although a recession is likely, it is expected to be shallow. The BoE are set to meet on 2 February with a near-70% probability priced in for another 50 basis-point rate hike (markets pricing in a terminal rate of around 4.5%).
The Bank of Japan (BoJ) stood pat on rates and resisted expanding YCC further, defying market expectations of further policy tweaks. This decision, of course, leaves the central bank’s policy rate at -0.10%. The immediate aftermath of the announcement witnessed the US dollar aggressively rally against the Japanese yen, advancing more than 2.3% after topping out at a high of ¥131.57. Interestingly, Friday watched the USD/JPY take on higher levels again, following comments from the BoJ Governor Kuroda at the World Economic Forum in Davos who essentially reaffirmed the BoJ’s policy stance. The World Economic Forum was a key talking point last week. European Central Bank (ECB) Christine Lagarde vowed to ‘stay the course’ and continue increasing interest rates. Asked about the possibility that the ECB might limit future rate increases, Ms. Lagarde said she would advise investors to ‘revise their position’ (WSJ).
Canada also released its latest inflation data, cooling to 6.3% in the 12 months to December, its lowest rate since February of 2022. Yet, this is still three times greater than the central bank’s 2% target, therefore there is still some way to go.
Equity Space
Major equity indices in Asia ended the week higher across the board, with the Nikkei 225 jumping 1.7%. Over in Europe, it was a different story as all major indexes fell. The UK’s FTSE 100 dropped nearly 1.0%, followed closely by the Euro Stoxx 50 falling 0.7%. The US saw the Dow dip 2.7% along with the S&P 500 losing 0.7%. Nasdaq, however, ended the week on the front foot by 0.7%. All three remain in the green year to date.
Earnings season is well and truly underway. Shares of Netflix (NFLX) ended the week firm after adding 7.66 million subscribers in Q4 of 2022, smashing the 4.6 million expected. It is also a busy earnings session this week, with Johnson & Johnson (JNJ) releasing their latest Q4 earnings in pre-market trading on Tuesday, alongside Microsoft (MSFT) after the market close. Tesla (TSLA) takes to the earning’s stage on Wednesday (aftermarket hours), together with International Business Machines (IBM).
Cryptocurrency Making a Comeback?
Last week witnessed bitcoin, Ethereum, Litecoin and Ripple stage an impressive run against the US dollar, up 9.6%, 6.7%, 1.7% and 3.8%, respectively. Bitcoin broke the $22,000 mark on Friday, with the major crypto trading comfortably above its 200-day simple moving average.
Economic Radar this Week
Note that banks in China are closed in observance of the Spring Festival (In terms of China, and the country’s economic outlook, Nordea Corporate do a good job of reporting current conditions here: https://corporate.nordea.com/article/80006/china-full-of-surprises).
Tuesday 24 January
Eurozone, UK and US Flash Manufacturing and Services PMIs for January between 8:15 am and 2:45 pm GMT
Yearly New Zealand Inflation Rate for Q4 at 9:45 pm GMT
Wednesday 25 January
Annual Inflation Rate for Australia for December at 12:30 am GMT
Bank of Canada (BoC) Interest Rate Decision at 3:00 pm GMT—short-term interest rate markets are currently pricing in a 70% probability for a 25 basis-point hike, pulling the overnight rate from 4.25% to 4.50%. Markets also expect the central bank to hit the pause button on future rate hikes at 4.50%
Thursday 26 January
Quarterly US Growth Rate (GDP - Advance) for Q4 at 1:30 pm GMT
Friday 27 January
Month-Over-Month US Core PCE Price Index for December at 1:30 pm GMT—this is a key event for the week and the Fed’s preferred measure of inflation
Technical View for the Week Ahead
Charts: TradingView
US Dollar Index
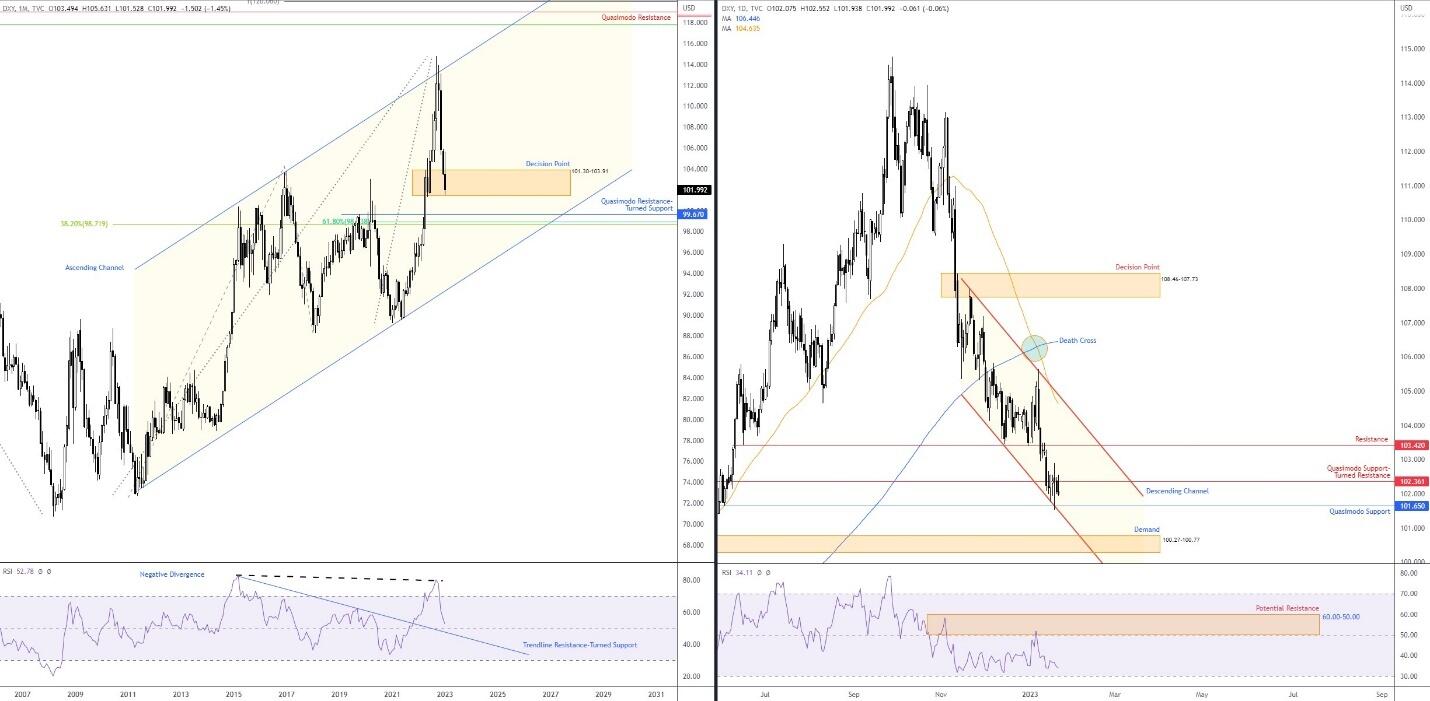
Despite wrapping up the week largely unmoved, the US dollar is on track to finish a fourth consecutive month under water, according to the US Dollar Index.
Following a one-sided deterioration in Q4 of 2022 from an ascending channel resistance, extended from the high 103.82, price action on the monthly scale is threatening to confront the lower perimeter of a decision point at 101.30-103.91.
As communicated in the previous weekly briefing, the research team underlined the following (italics):
Clearing the aforementioned monthly decision point reopens the risk of a further decline to monthly Quasimodo resistance-turned possible support at 99.67, closely tailed by a mild Fibonacci cluster just south of 99.00. In terms of the RSI, we can also see scope to drop in on the 50.00 centreline, a barrier that could offer indicator support. But, despite the above, while bears are clearly in the driving seat right now, trend direction has remained to the upside since early 2008 and the recent down move could just be another correction.
Meanwhile on the daily timeframe, trend direction continues to favour shorts. This is shown through the recent Death Cross. Fashioned through the 50-day simple moving average (104.64) crossing under the 200-day simple moving average (106.45), this signals the potential for a major trend reversal (though this is a lagging indicator and reflects past price movement). In addition to this, since establishing a peak (see monthly analysis), a series of lower lows and highs materialised (traditional bearish trend structure).
Knowing monthly price is treading water deep within a decision point, buyers and sellers on the daily chart are currently squaring off between Quasimodo support-turned resistance at 102.36 and Quasimodo support from 101.65 (merging with channel support, extended from the low 103.45). The recent consolidation, given the lack of buying on the monthly scale and the downtrend evident on the daily chart, is poised to breakout to the downside this week. Technically speaking, the aforesaid supports are the last line of defence for the monthly timeframe’s decision point. As a result, a breakout lower may encourage renewed selling, targeting at least daily demand at 100.27-100.77.
Finally, aligned with the daily downside bias, the daily timeframe’s RSI shows a temporary overbought region between 60.00 and 50.00. This is common in strong downtrends; therefore, this might be a location to keep an eye on over the coming weeks for signs of negative divergence and bearish failure swing signals.
EUR/USD
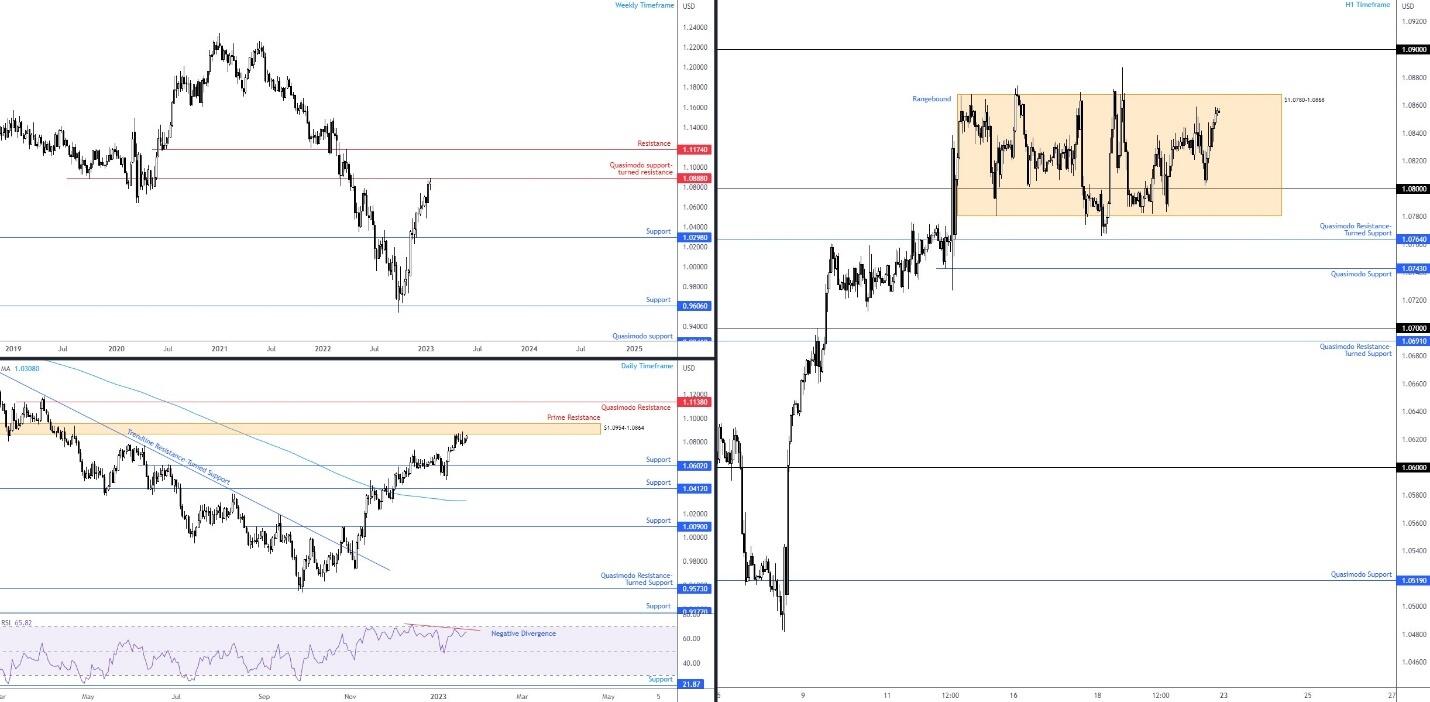
Europe’s common currency finished the week hesitantly against its US counterpart, reaching highs not seen since April 2022. Interestingly, with the weekly Quasimodo support-turned resistance at $1.0888 currently holding price, is this enough to underpin a bearish scene this week? The weekly timeframe has been entrenched within a downtrend since topping in 2021 and the pullback off the late September lows at $0.9536 might be viewed as a sell-on-rally opportunity. Hence, $1.0888 will be key to monitor this week as rupturing the level exposes resistance coming in at $1.1174.
It was noted in previous technical research that prime resistance on the daily timeframe at $1.0954-1.0864 supports the current weekly resistance level. Albeit healthy confluence, bumping higher this week unearths Quasimodo resistance at $1.1138 while dropping from the aforementioned prime resistance has support in view at $1.0602.
The research team wrote the following in recent writing regarding the daily chart’s trend and momentum (italics):
On the daily chart, an uptrend is clear through the recent series of higher highs/lows, as well as price crossing above its 200-day simple moving average, currently fluctuating around $1.0308. We can also see that the moving average is starting to level off from its down move: another sign of a potential trend reversal to the upside. The Relative Strength Index (RSI), nonetheless, is seen printing early negative divergence, effectively backing a downside move from the daily prime resistance.
Away from the bigger picture, short-term price action exhibits a clear-cut range between $1.0780 and $1.0868, active since 12 January. Outside of the consolidation, eyes will be on $1.09 resistance and Quasimodo resistance-turned possible support from $1.0764.
Given the active weekly and daily resistances, and the weekly timeframe’s bearish narrative still hanging on (just), a break of the H1 timeframe’s range could be seen to the downside. Such an event materialising might see short-term breakout sellers surface south of the H1 Quasimodo resistance-turned potential support at $1.0764, targeting H1 Quasimodo support from $1.0743 and the $1.07 figure. Alternatively, a bearish scenario could unfold at the upper edge of the H1 range ($1.0868), in line with the mentioned structure. The concern, nevertheless, is the US Dollar Index gearing up for a potential leg lower which would reinforce the EUR/USD for a breakout to the upside.
On account of the above, conservative traders will likely continue to play the extremes of the current H1 range this week until a decisive breach materialises, a move that would open the door to breakout trading opportunities.
S&P 500
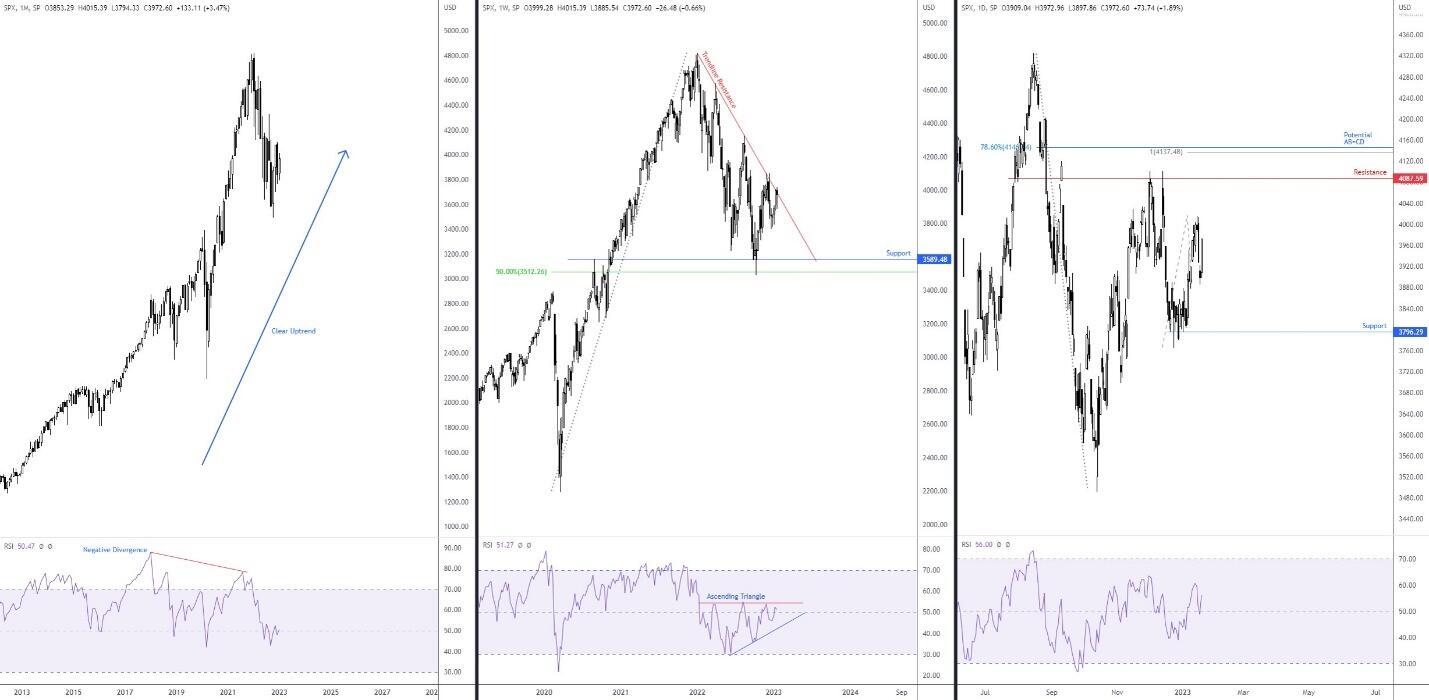
Snapping a two-week winning streak, last week welcomed a bearish showing, down 0.7%.
While further underperformance is a possibility, recognising that price declined from trendline resistance last week (drawn from the high at 4,818), bulls might still have the upper hand and a break north could be on the table.
The monthly timeframe is simple. Here is a reminder of the research team’s notes in recent analysis (italics):
The monthly chart has remained in a dominant uptrend since early 2009. We had two notable corrections in that time, one in early 2020 (COVID), dropping 35%, and one in play since early 2022 (down 27% from 4,818, as of writing) which was accompanied by negative divergence out of the Relative Strength Index (RSI).
The following was noted on the weekly timeframe’s technical structure in the latest analysis (italics):
Across the page on the weekly timeframe, price action has respected trendline resistance (drawn from the high mentioned above at 4,818) during the latest correction mentioned on the monthly chart. Still, following the rebound from support at 3,589 and a 50.0% retracement at 3,512 in mid-October (2022), price appears set to dethrone the noted trendline resistance (lack of bearish interest). Technically, a disruption here would help reaffirm the monthly chart’s uptrend. Adding to this, the RSI, since March 2022, has been establishing an ascending triangle between 53.60 and 30.47. While these patterns are frequently seen in uptrends, they can represent reversal structure in downtrends. Consequently, a breakout above both the triangle formation, together with the noted trendline resistance, may underpin a longer-term bid in this market.
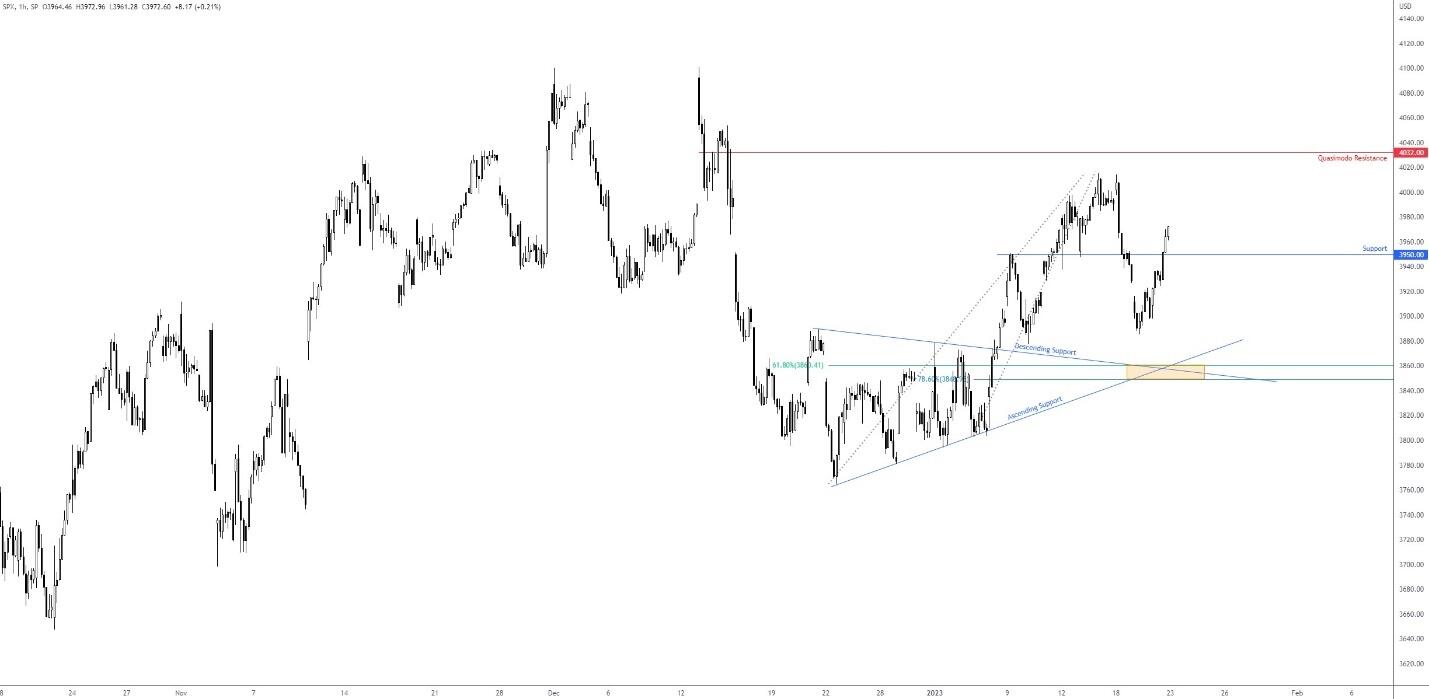
Directing attention to the daily timeframe, price is working between support at 3,796 and resistance drawn from 4,087. Harmonic traders may also note the possible AB=CD bearish formation at 4,137, marked by a 100% projection, and a nearby 78.6% Fibonacci retracement ratio at 4,146.
Finally, on the H1 timeframe, support between 3,848 and 3,860 was left unchallenged in recent trading after the index bottomed at 3,885 on Thursday. This area consists of 78.6% and 61.8% Fibonacci retracement ratios, alongside an ascending support, drawn from the low of 3,764, and a descending support, taken from the high of 3,889. Overhead, following the resistance breach at 3,950, January peaks are targeted at 4,015, followed by Quasimodo resistance at 4,032. Breaching 3,950 also helps confirm bullish intent, bolstering the possibility of further buying on the daily timeframe this week and, by extension, a break of the weekly trendline resistance.
Monthly, Weekly and Daily Charts:
H1 Chart:
XAU/USD (Gold)
It was another positive week for the yellow metal, adding 0.3% and chalking up a fifth consecutive week in the green.
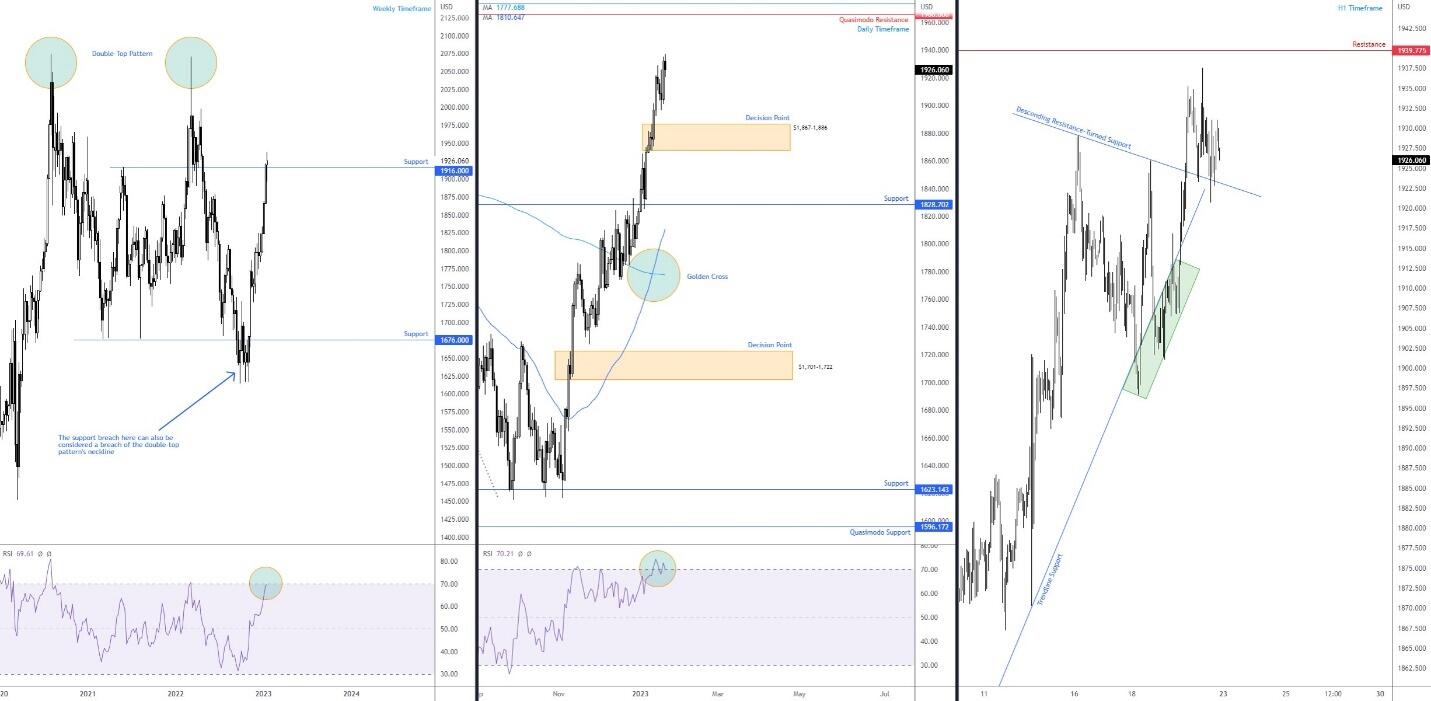
The key development on the weekly timeframe was the break and retest of resistance at $1,916 and reaching highs of $1,937, levels not seen since April 2022. Fashioning support from the aforementioned resistance places the technical spotlight on the double-top pattern’s peaks at around $2,070. However, it’s important to note that the Relative Strength Index (RSI) is at the doorstep of overbought territory, consequently further outperformance could be lethargic.
Elsewhere on the daily timeframe, the decision point at $1,867-1,886 was left unopposed last week. While still a valid area of technical interest, Quasimodo resistance is now on the radar at $1,966, accompanied by a 78.6% Fibonacci retracement at $1,973 (blue). Nevertheless, similar to the weekly chart, the daily timeframe’s RSI is registering overbought conditions, therefore the pace of buying might slow despite scope to approach resistance.
As a reminder of trend direction on the daily chart, here is where the research team stands at the moment (italics):
The trend is now technically higher. The reversal presented itself in early December last year following the break of the $1,786 previous high in November 2022. Since then, the precious metal also recently welcomed what is known as a Golden Cross, which is the 50-day simple moving average ($1,810) crossing above the 200-day simple moving average ($1,777). This is a pattern trend followers tend to watch and can signal the possibility of a long-term uptrend.
Friday’s technical briefing noted the following in terms of the H1 scale (italics):
Despite marginally violating trendline support on the H1 chart (green), drawn from the low $1,825, buyers found grip and reclaimed position north of the ascending line on Thursday. Another technical observation on the H1, which also bolsters a bullish case for the yellow metal, is that the first leg lower from $1,929 (16 January) bottomed at $1,896, while the second leg south from $1,925 (18 January) failed to form a lower low at $1,901. This informs market participants that buyers are gaining traction and a break above the local descending resistance (etched from $1,929) could be seen today.
As evident from the H1 chart, we have indeed seen the metal push higher, breaking the local descending resistance which welcomed a retest in the form of support on Friday. This—coupled with weekly price breaking/retesting breached resistance and scope to rally on both weekly and daily timeframes—bolsters the case for another leg higher and places H1 resistance on the radar at $1,939 this week.
Thanks to bitcoin powering higher versus the US dollar on Friday (+7.5%), BTC/USD is on track to wrap up the week in positive double figures.
Concerning the weekly timeframe, the research team noted much of the following in Friday’s technical briefing (italics):
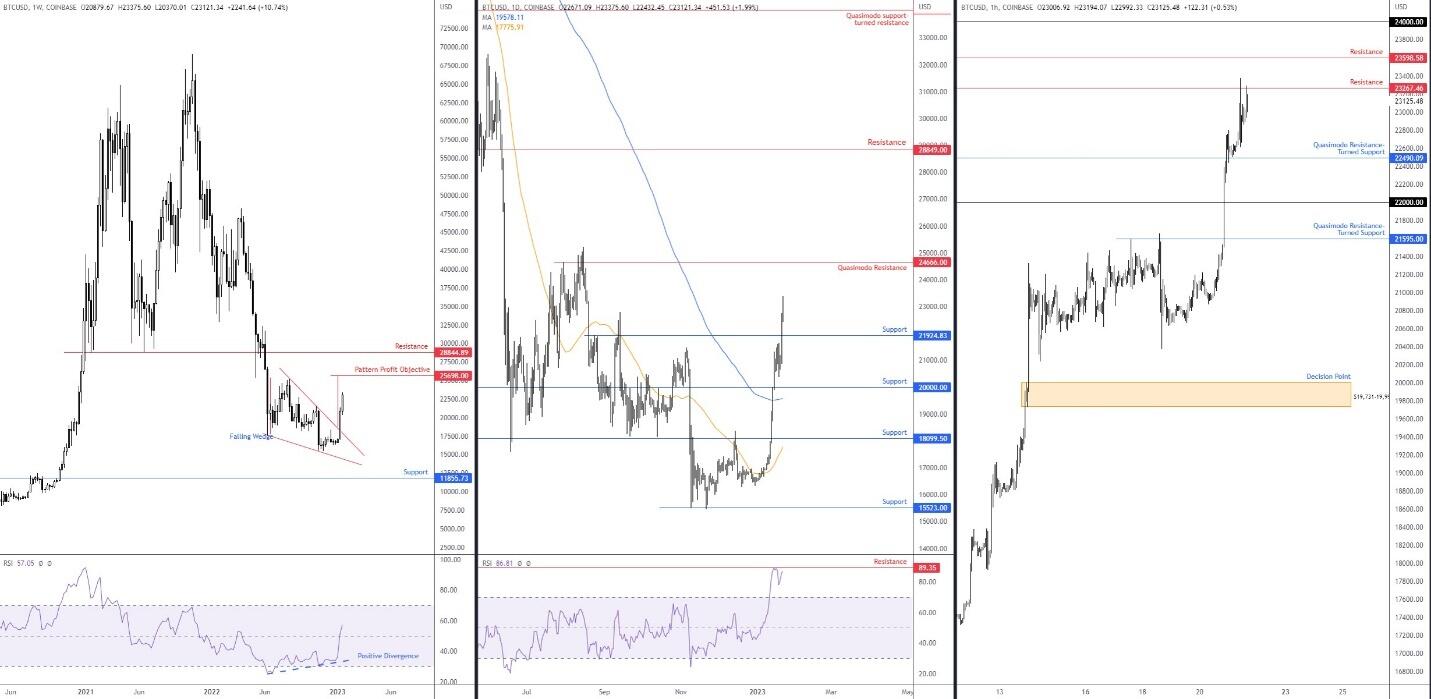
The weekly timeframe shows BTC/USD gained some grip north of support at $11,855 and hammered through the upper limit of a falling wedge pattern (reversal structure), drawn between $25,214 and $17,567. You will note this was accompanied by the Relative Strength Index (RSI) chalking up positive divergence ahead of oversold territory (the indicator also recently crossed above its 50.00 centreline [positive momentum]). Aside from the local tops (evident on the daily chart), the falling wedge pattern profit objective is set at $25,698, closely trailed by resistance at $28,844.
Meanwhile, the daily timeframe shows the price of the major cryptocurrency convincingly scaled through resistance at $21,924, which is now marked as support. As of writing, though, the unit is seen attempting to overthrow the $22,800 13 September high (2022) which if dethroned could pave the way for follow-through buying to as far north as Quasimodo resistance at $24,666. Note that this level is arranged just south of the weekly timeframe’s falling wedge pattern profit objective at $25,698. Also, while the weekly timeframe’s RSI is exploring above its 50.00 centreline, the daily chart’s RSI confronted indicator resistance at 89.35, testing levels not seen since the beginning of 2021.
Still on the daily scale, we can see that the recent outperformance in early January forged a fresh higher high (breaking the $18,385 14 December high), and crossed above both the 50-day and 200-day simple moving averages, currently trading at $17,775 and $19,578, respectively. Therefore, the trend is showing early signs of an upside reversal.
From the H1 timeframe, following a test of a Quasimodo resistance-turned support at $22,490 at the weekend, resistance is seen in play at $23,267. In line with scope to advance on the bigger picture, H1 buyers pushing for moves above here to at least $23,598 resistance is likely, followed by $24,000.
Author

Aaron Hill
FP Markets
After completing his Bachelor’s degree in English and Creative Writing in the UK, and subsequently spending a handful of years teaching English as a foreign language teacher around Asia, Aaron was introduced to financial trading,


