Market Ends on a Positive Note
US Dollar: Dec. USD is Down at 96.280.
Energies: Dec '18 Crude is Up at 57.16.
Financials: The Dec 30 year bond is Down 9 ticks and trading at 139.09.
Indices: The Dec S&P 500 emini ES contract is 4 ticks Lower and trading at 2742.00.
Gold: The Dec Gold contract is trading Down at 1220.00. Gold is 30 ticks Lower than its close.
Initial Conclusion
This is not a correlated market. The dollar is Down- and Crude is Up+ which is normal and the 30 year Bond is trading Lower. The Financials should always correlate with the US dollar such that if the dollar is lower then bonds should follow and vice-versa. The S&P is Lower and Crude is trading Higher which is correlated. Gold is trading Down- which is not correlated with the US dollar trading Lower. I tend to believe that Gold has an inverse relationship with the US Dollar as when the US Dollar is down, Gold tends to rise in value and vice-versa. Think of it as a seesaw, when one is up the other should be down. I point this out to you to make you aware that when we don't have a correlated market, it means something is wrong. As traders you need to be aware of this and proceed with your eyes wide open.
At this hour all of Asia is trading Higher with the exception of the Singapore exchange which is Lower at this time. Currently all of Europe is trading Higher.
Possible Challenges To Traders Today
-
NAHB Housing Market Index is out at 10 AM EST. This is major.
-
FOMC Member Williams Speaks at 10:45 AM EST. This is major
Treasuries
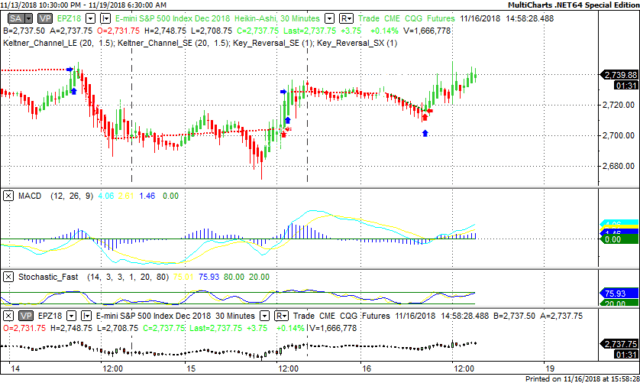
We've elected to switch gears a bit and show correlation between the 30 year bond (ZB) and The YM futures contract. The YM contract is the DJIA and the purpose is to show reverse correlation between the two instruments. Remember it's liken to a seesaw, when up goes up the other should go down and vice versa.
On Friday the ZB made it's move at around 8 AM EST. The ZB hit a High at around that time and the YM hit a Low. If you look at the charts below ZB gave a signal at around 8 AM EST and the YM was moving Higher at the same time. Look at the charts below and you'll see a pattern for both assets. ZB hit a High at around 8 AM and the YM was moving Higher at the same time. These charts represent the newest version of MultiCharts and I've changed the timeframe to a 30 minute chart to display better. This represented a Shorting opportunity on the 30 year bond, as a trader you could have netted about a dozen ticks per contract on this trade. Each tick is worth $31.25.
Charts Courtesy of MultiCharts built on an AMP platform.
 and The YM futures contract. The YM contract is the DJIA and the purpose is to show reverse correlation between the two instruments. Remember it's liken to a seesaw, when up goes up the other should go down and vice versa. On Friday the ZB made it's move at around 8 AM EST. The ZB hit a High at around that time and the YM hit a Low. If you look at the charts below ZB gave a signal at around 8 AM EST and the YM was moving Higher at the same time. Look at the charts below and you'll see a pattern for both assets. ZB hit a High at around 8 AM and the YM was moving Higher at the same time. These charts represent the newest version of MultiCharts and I've changed the timeframe to a 30 minute chart to display better. This represented a Shorting opportunity on the 30 year bond, as a trader you could have netted about a dozen ticks per contract on this trade. Each tick is worth $31.25. Charts Courtesy of MultiCharts built on an AMP platform Click on an image to enlarge it. https://markettealeaves.com/assets/ZB111611811111png11111111111111111111111111111111111111111111111111111111111111111-640x383.png ZB - Dec, 2018 - 11/16/18 https://markettealeaves.com/assets/YM111611811111png111111111111111111111111111111111111111111111111111111111111111111-1-640x383.png YM- Dec, 2018 - 11/16/18 Bias On Friday we gave the markets a Downside bias as the USD, Crude, the Bonds and Gold were all trading Higher Friday morning and this usually reflects a Downside day. The markets had other ideas as the Dow closed Higher by 143 points, the S&P by 8 but the Nasdaq closed Lower. Today we aren't dealing with a correlated however our bias is Neutral. Could this change? Of Course. Remember anything can happen in a volatile market. Commentary On Friday it would seem that the markets were correlated to the Downside, hence our downside bias. However the markets had other ideas as the Dow and S&P both closed Higher. This is why we say each and every day "this can change" because it can. Today we have NAHB Housing Market Index and an FOMC Member speaking, both of which are major and both proven market movers. This is something to be mindful of if trading today.)
Bias
On Friday we gave the markets a Downside bias as the USD, Crude, the Bonds and Gold were all trading Higher Friday morning and this usually reflects a Downside day. The markets had other ideas as the Dow closed Higher by 143 points, the S&P by 8 but the Nasdaq closed Lower. Today we aren't dealing with a correlated however our bias is Neutral.
Could this change? Of Course. Remember anything can happen in a volatile market.
Commentary
On Friday it would seem that the markets were correlated to the Downside, hence our downside bias. However the markets had other ideas as the Dow and S&P both closed Higher. This is why we say each and every day "this can change" because it can. Today we have NAHB Housing Market Index and an FOMC Member speaking, both of which are major and both proven market movers. This is something to be mindful of if trading today.
Author

Nick Mastrandrea
Market Tea Leaves


