Market Brief: volatility Remains Calm As Tensions Recede

FX Brief:
-
Both US and Iran continued to signal their desire to avoid further conflict.
-
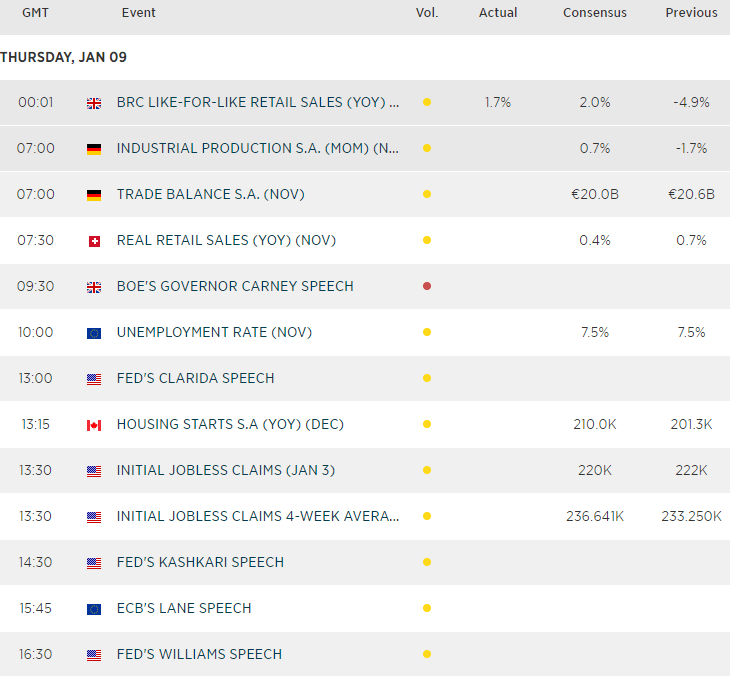
China’s inflation steadies at 4.5% YoY and, whilst still relatively high, is not feared high enough to stave off further stimulus from PBOC. Producer prices fell for a fifth consecutive month, although at a slower pace.
-
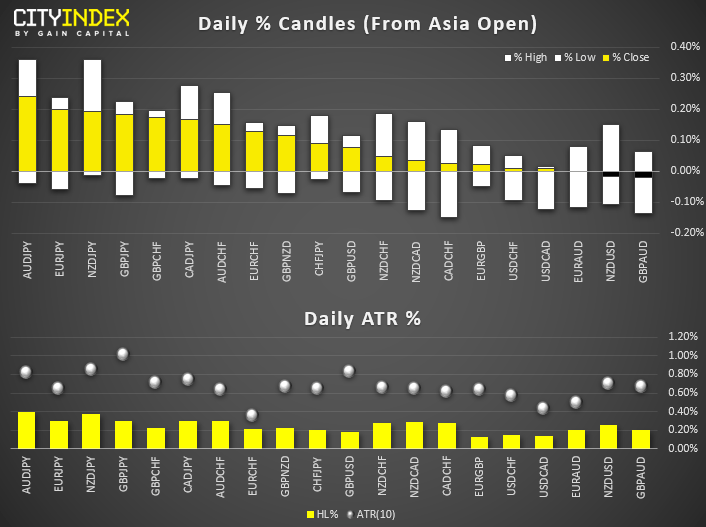
The lack of geopolitical tensions or economic data made for a session of tight ranges. GBP and AUD are the strongest majors, JPY and CHF are the weakest.
Price Action:
-
DXY trades just off of yesterday’s highs, after it broke above 97.11 resistance. However, its found resistance at the September trendline (which broke in December) so upside may be limited over the near-term.
-
USD/JPY is considering a break of yesterday’s high. Near-term bias remains bullish above 108.86.
-
USD/CAD closed back above the 2019 low to suggest a correction is underway. However, keep an eye on the bearish trendline on the 4-hour chart which could aid as a bullish target, or area for bears to fade into.
-
Gold remains anchored to the September 2019 high around 1557. Given the elongated, bearish hammer (also and outside and engulfing candle) and its failure to break 1600, it’s likely this could be the beginning of a retracement from its highs.
-
NZD pairs are carving out a base and currently consolidating in tight ranges after printing a series of large hammers or doji’s yesterday. Bias remains bullish whilst they hold above their respective lows.
Equities Brief:
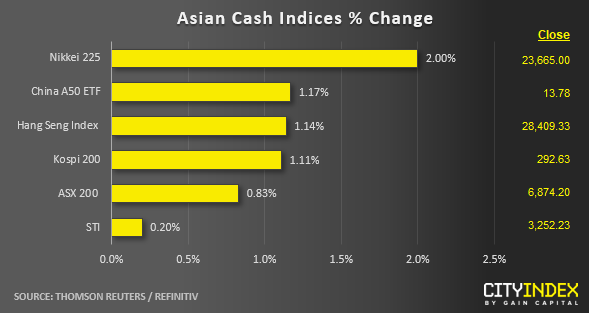
Most Asian stock markets have recovered all their respective earlier losses inflicted by the U.S-Iran tensions that blew up on last Fri, 03 Jan. Right now, the leaders of both sides have acted in “good faith” to restrain further physical retaliation moves after yesterday’s Iran missile strikes on U.S. military bases in Iraq.
China’s Production Price Index (PPI) for Dec has declined slightly below expectation (-0.5% y/y versus -0.4% y/y consensus where previous data stood at -1.4% y/y). The pace of contraction has continued to subside since Oct 2019 where the risk of deflation recedes.
On the other hand, China’s inflation rate has continued to stay at a 8-year high where the Consumer Price Index (CPI) recorded a rise of 4.5% y/y in Dec (slightly below consensus forecast of 4.7% y/y) on the backdrop of rising pork prices due to the prolonged African swing fever epidemic.
Muted performance in the Singapore stock market where the benchmark Straits Times Index stood almost unchanged; Huge gains of almost 2% seen in Singapore Exchange and CapitaLand Commercial Trust have been offset by losses in Comfortdelgro and UOL; -1.30% and -1.19% respectively.
Price Acton (derived from CFD indices):
US SP 500: Another attempt to retest the current all-time high area of 3263/67 in today’s Asian session. No clear signs of bullish exhaustion at this juncture with a further potential to see another push up to target the 3280 key medium-term pivotal resistance; short-term key support at 3242 (former minor descending trendline from 03 Jan 2020 high that has been taken out yesterday after U.S. President Trump’s official address on Iran’s retaliation missile strikes & 23.6% Fibonacci retracement of yesterday’s push up from 3181 low to 3267 high).
Japan 225: Short-term/4-hour Stochastic oscillator has reached an extreme overbought level with price action now below 23770 (former swing low areas of 20/26 Dec 2019 that saw an upside price rejection on 03 Jan 2020). Watch the 23480 key short-term support (former minor descending channel resistance from 27 Dec 2019 high & ascending trendline). An hourly close below 23480 negates the bullish tone for a slide back to retest 23040/23000.
Hong Kong 50: Short-term/4-hour Stochastic oscillator has reached an extreme overbought level with price action now at the recent intermediate swing high areas of 03/07 Jan 2020 acting as resistance at 28470. An hourly close below 28100 negates the bearish tone to retest yesterday low of 27825.
Australia 200: Current push up has seen rejection again at the 6880/90 (current all-time high area) for the 4th time with a bearish divergence signal seen in the short-term/hourly RSI oscillator. A break below 6820 may see a push down to retest the minor ascending trendline from 02 Jan 2020 low now acting as a support at 6760.
Germany 30: Pushed up to retest the 13450 medium-term range resistance in place since 13 Dec 2019 with an extreme overbought reading seen in the 4-hour Stochastic oscillator. Watch the 13275 near-term support and an hourly close below it may see a slide towards the 12950/900 medium-term range support.
Author

Matt Simpson, CFTe, MSTA
CityIndex
Matt Simpson is a certified technical analyst who combines charts and fundamentals to generate trading themes.


