GBP/USD regains ground after US data and finds an equilibrium

GBP/USD was trading at 1.3632 on Thursday. Sterling found an equilibrium point after volatility triggered by a stronger dollar following US labour market data.
The number of people employed in January increased by 130 thousand, marking the largest rise in more than a year. The unemployment rate unexpectedly fell to 4.3%. Against this backdrop, investors have revised expectations for the Fed rate path. The market now fully prices in the first rate cut for July rather than June, and the probability of a move in March is estimated at less than 5%.
Partial support for the pound came from a decline in domestic political uncertainty. British Prime Minister Keir Starmer received the backing of key cabinet members and Labour Party representatives after the resignation of Chief of Staff Morgan McSweeney amid the scandal surrounding Lord Peter Mandelson.
At the same time, market participants still expect further easing from the Bank of England. The regulator kept the rate at 3.75% but delivered softer guidance. It indicated that inflation could return to the 2% target from April.
Technical analysis
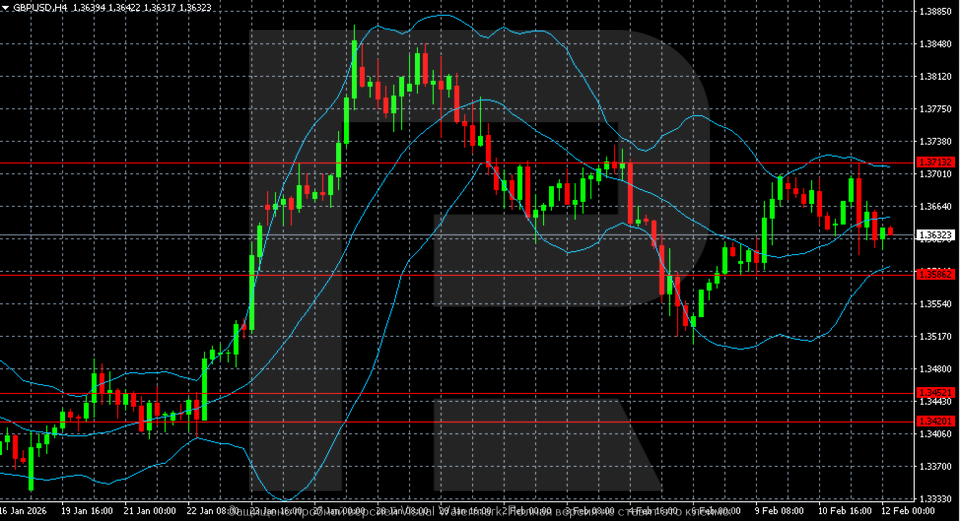
The H4 chart for GBP/USD shows that after a brief rise to 1.3850, the pair entered a correction. A downward phase has formed, characterised by lower highs and lower lows. The price is now testing the 1.3580–1.3600 support zone. The Bollinger Bands are pointing downward, and volatility remains elevated. As long as the pair remains below 1.3710–1.3730, downside pressure is likely to persist.
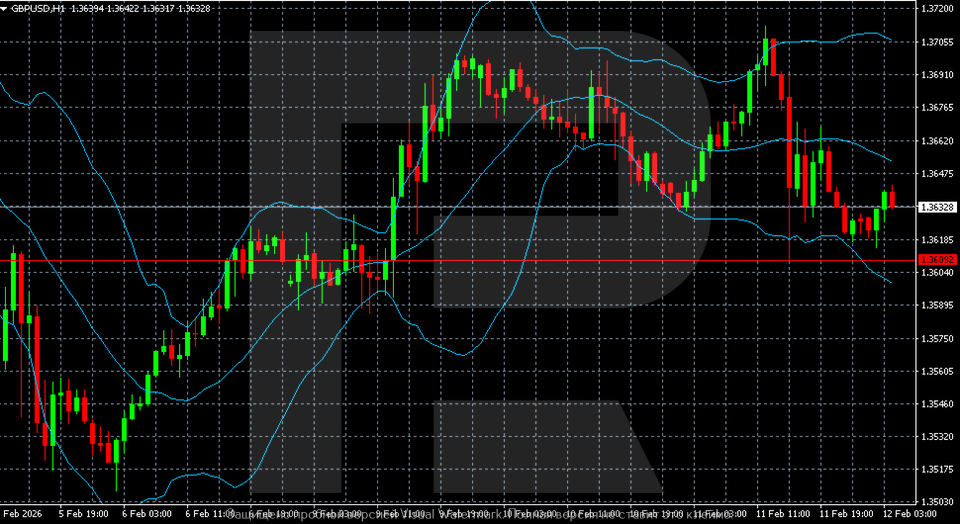
On the lower H1 timeframe, a local recovery from 1.3580 is visible, but the structure remains neutral to bearish. The price is trading within the 1.3580–1.3650 range. The Bollinger Bands' midline acts as short-term resistance. A sustained move above 1.3660 would open the way towards 1.3700. A move back below 1.3600 would increase the risk of a retest of recent lows.
Conclusion
In summary, GBP/USD has stabilised following a sharp repricing of Fed expectations triggered by robust US jobs data. The pair found technical equilibrium near key support, with political relief at home providing some offsetting support for sterling. However, the broader technical structure remains corrective and neutral-to-bearish, with resistance capping recovery attempts. The near-term direction hinges on two factors: whether the 1.3580–1.3600 support zone holds, and any further divergence in tone between a patient Fed and an increasingly dovish Bank of England. Until GBP/USD reclaims 1.3660–1.3700, downside risks remain elevated.
Author

RoboForex Analysis Department
RoboForex
RoboForex Analysis Department provides timely market insights, expert technical analysis, and actionable forecasts across forex, commodities, indices, and equities.


