Many Indicators Point to Early 2020 Downturn
The yield curve first flirted with inversion earlier this year. That occurred clearly recently when the 2-year Treasury bond yield crossed below the 10-year, and it has done that further more recently.
But that indicator can lead by nine months to 22 months. And Treasury bond yields have been so manipulated in the last decade of QE that who knows how meaningful that is anyway…
But certainly, this indicator is more of a warning of falling growth, as the real trend is that long-term bond yields are plummeting as the bond market sees slowing U.S. and global growth. That has been a big part of the recent correction in stocks.
But there are other, more fundamental leading indicators that are more meaningful.
Dow Jones Home Construction Index
My first non-mainstream indicator was the Dow Jones Home Construction index that peaked in late 2005, 26 months before the stock peak in October 2007. That peaked in early January 2018 suggesting on a similar lag a stock top around March of 2020.
That index has had a stronger counter rally into July than it did into early 2007 before declining again. That has been due to the unusual trend of interest rates going down into a late stage boom due to Fed easing again. It would be more confirming if that index started turning down again soon, as it looks likely to do as home sales continue to weaken.
I showed recently that RV sales peaked in 2017 and have accelerated down 20% year-over-year into 2019. That also led the October 2007 top and January 2008 recession by almost two years and suggest very early 2020.
But there are two stock sectors that also led the last top and are telling the same story: the retail and financial sectors.
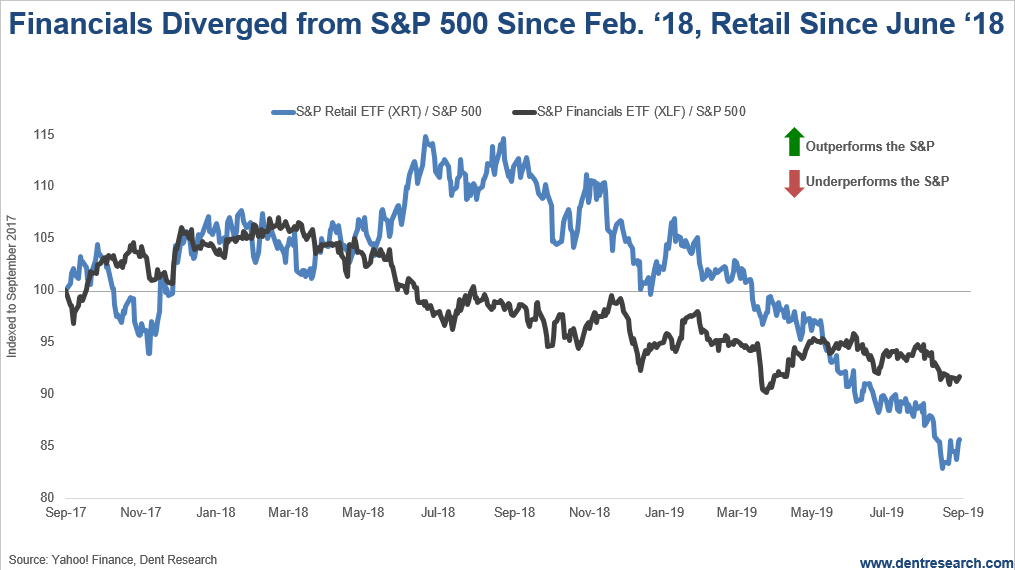
The financial and retail sectors started underperforming the S&P 500 before the 2007 top as well, and they are doing it again. Financials peaked in February 2018 and have been largely underperforming ever since. The retail sector peaked in July 2018 and has underperformed even more so. Amazon has underperformed the S&P 500 since June 2018. It appears to be turning down again.
Consumer Discretionary Signals
The consumer discretionary sector has also been underperforming the consumer staple sector since June 2018, meaning consumers are increasingly buying what they need, not what they want. How long can you keep lowering rates until all consumers have refinanced, or bought a new car or house if they were going to?
And consumer confidence has continued to rise since 2014 while GDP growth peaked and has been steadily declining. Those two have rarely diverged that long. Yet, consumer sentiment from the Michigan Survey suddenly plummeted to just below 90 in August after hitting 100 in late May and still at 98 in July. So that may already be crashing fast.
Elsewhere, there are other reports of high-end consumer spending falling, including real estate in the hottest areas from London to Manhattan to San Francisco. I have seen discounts on luxury cars similar to the one I got on a Maserati in early 2009: 20-25%! The entire dealer margin isn’t even that much.
The trends are clear from all angles. Despite never-ending stimulus and now one-time tax cuts at the beginning of 2018, we keep returning to that dreaded 2% real growth. At some point the fundamentals will win and kicking the can down the road will lose. That looks like it will occur early next year…
What Will Donald Do?
The wild card is obviously how much can Desperate Donald get away with in the last minute, desperate stimulus programs like a payroll tax holiday for the everyday citizen to get direct cash benefits? Or maybe he just talks the Congress into sending everyone a $5,000 check printed by the Fed from thin air, if they spend it before the election… but, that would be really cheesy!
Doesn’t look any more whacky and desperate than what we’ve already seen from central banks and the Donald to me. Imagine how history looks at these accomplished grown men and women feeding the economy “crack” and thinking it could all work out okay.
At best, stocks peak by early next year; at worst, just after the election, if the Donald pulls off one more major magic trick. But the wheels may already be too much in motion for even that.
If he does manage to get re-elected, he will really wish he hadn’t as he could have blamed it on the Fed when he got defeated and not be on the hot spot for the crash of a lifetime.
Author

Harry S. Dent, MBA
Dent Research
Harry S. Dent Jr. studied economics in college in the ’70s, but found it vague and inconclusive. He became so disillusioned by the state of his chosen profession that he turned his back on it.


