Majors technical outlook
EUR/USD
It was a relatively subdued session for EUR/USD on Monday, weighed by a light economic calendar. The technical landscape remains unchanged on the weekly, daily and H4 timeframes, therefore for those charts the following analysis will serve as a reminder:
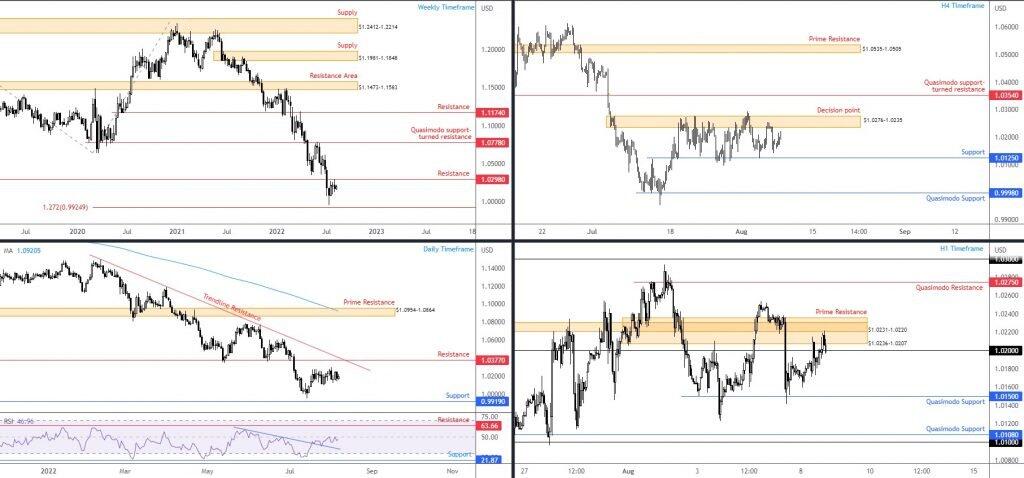
Out of the weekly timeframe, the currency pair managed to come within a whisker of resistance at $1.0298 last week, a level boasting technical relevance since the year 2000. The near test of resistance, together with the EUR/USD trading lower since the beginning of 2021 (primary bear trend), highlights a potential sell-on-rally scenario over the coming weeks.
Resistance at $1.0377 on the daily timeframe continues to draw attention as not only is it located nearby the weekly resistance level, it dovetails with daily trendline resistance, extended from the high $1.1495. The daily chart’s relative strength index (RSI) is also still nibbling at the lower side of the 50.00 centreline, following a break/retest of trendline resistance, drawn from the high 58.91.
The H4 timeframe is working between a decision point at $1.0276-1.0235 and support coming in at $1.0125, fashioning a range since 19th July. Additional levels to be mindful of are Quasimodo support from $0.9998 and a Quasimodo support-turned resistance at $1.0354.
Knowing that weekly price continues to touch gloves with space nearby resistance at $1.0298, in a market trending lower since 2021, a whipsaw north of $1.02 on the H1 into prime resistance at $1.0236-1.0207 should not surprise.
As a result, a H1 bearish close under $1.02 after testing the H1 prime zone could be sufficient to prompt a bearish scenario to take on H4 support at $1.0125 and test the $1.01 region on the H1 scale this week.
As evident from the H1 chart, price has whipsawed above $1.02 and tested the H1 prime resistance area at $1.0236-1.0207, as well as the smaller prime resistance resting inside at $1.0231-1.0220. Should price cement some form of position under $1.02 today, H1 Quasimodo support warrants attention at $1.0150 as an initial downside objective, followed by H4 support coming in at $1.0125.
Technical expectation:
According to chart studies, H1 price is expected to close below $1.02 with further selling likely on the table until at least H1 Quasimodo support from $1.0150.
AUD/USD
Amid lower US Treasury yields across all maturities and moderately soft demand for the greenback, the Australian dollar finished Monday higher by 1.0 per cent.
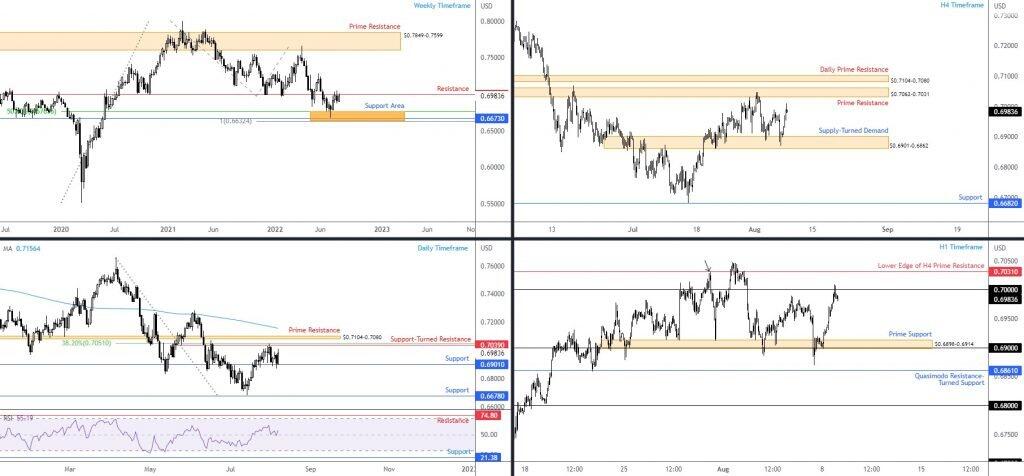
While the somewhat spirited start to the week was underpinned by support on the daily timeframe from $0.6901, buyers have their work cut out for them. In addition to trending lower since early 2021, weekly resistance welcomed price movement on Monday at $0.6996, which happens to boast historical meaning since 2020. On top of this, the daily timeframe throws light on neighbouring resistance at $0.7039— accompanied by a 38.2% Fibonacci retracement at $0.7051 and a nearby prime resistance at $0.7104-0.7080.
In previous research, I did note that a drop under daily support, and the daily chart’s relative strength index (RSI) voyaging under the 50.00 area (negative momentum), would add weight to the weekly timeframe’s resistance. Though for now that has yet to come to fruition.
Supply-turned demand at $0.6901-0.6862 on the H4 timeframe served well on Monday, elevating the unit to within a stone’s throw of prime resistance at $0.7062-0.7031. The daily prime resistance just above here at $0.7104-0.7080 will likely draw attention should price dethrone $0.7062-0.7031.
Lower on the curve, buyers and sellers are squaring off at $0.70, a widely watched psychological level. Overhead, the lower edge of the H4 prime resistance is marked at $0.7031, which happens to form a Quasimodo resistance level (left shoulder seen at the black arrow). The $0.6898-0.6914 prime support calls for attention to the downside on the H1 scale, merging with the $0.69 figure.
Technical expectation:
Between daily resistance at $0.7039 and weekly resistance at $0.6996 is an area sellers could respond to on the bigger picture. The daily prime resistance at $0.7104-0.7080 is also a key watch should buyers overstretch at the noted resistance area.
More immediate, of course, is the $0.70 figure (H1) and its connection with weekly resistance at $0.6996. Therefore, this may also be a location we see sellers show themselves from.
USD/JPY
Monday witnessed moderate losses for the USD/JPY currency pair, influenced by a feeble USD and a drop in US Treasury yields.
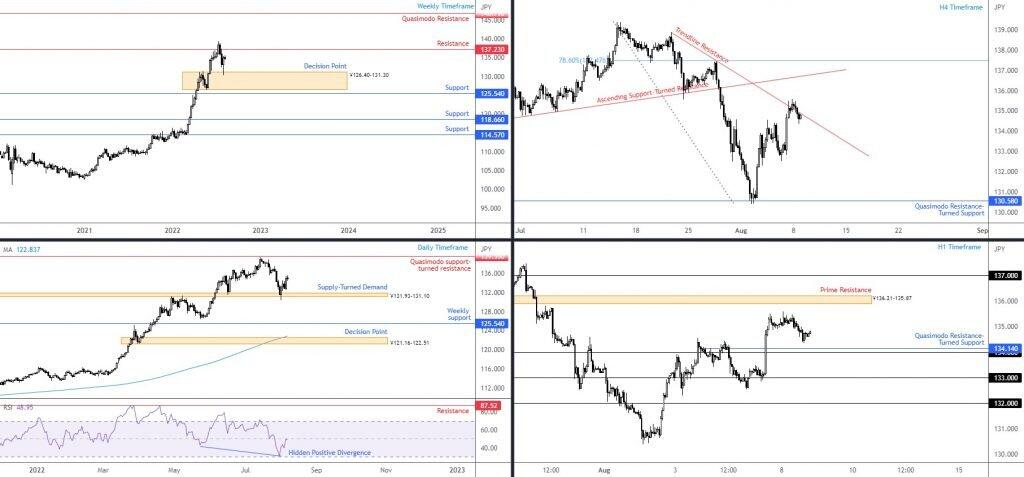
From the weekly timeframe, action staged an impressive comeback from a decision point at ¥126.40-131.30 and firmly placed resistance at ¥137.23 back in the frame. Should the aforementioned level cede ground, in line with the primary bull trend (since 2021), fresh 24-month peaks will likely be recorded and Quasimodo resistance at ¥146.79 is noted.
In terms of the daily timeframe, here’s where I left this chart in Monday’s weekly technical briefing (italics):
Supply-turned demand at ¥131.93-131.10 on the daily timeframe, which happens to be glued to the upper side of the weekly decision point, put in an appearance last week. Resistance is seen at ¥139.55: Quasimodo support-turned resistance that came within a whisker of putting in an appearance in mid-July. Interestingly, the daily timeframe’s relative strength index (RSI) has now reconnected with the lower side of its 50.00 centreline after coming within an inch of testing oversold space and forming hidden positive divergence. Dethroning the 50.00 level would add weight to last week’s push, informing market participants that average gains are exceeding average losses (positive momentum).
Trendline resistance, drawn from the high ¥138.88, remains in play on the H4 scale. Albeit experiencing a mild breach, sellers appear to be warming to the descending line. Assuming a break, an ascending support-turned resistance is seen (taken from the low ¥134.27), which is joined closely with a 78.6% Fibonacci retracement at ¥137.48. Quasimodo resistance-turned support at ¥130.58, however, is seen lower.
Finally, on the H1 timeframe, price appears set to revisit ¥134 and the nearby Quasimodo resistance-turned support at ¥134.14. A rebound from the aforesaid levels could send price as far north as prime resistance at ¥136.21-135.87 and perhaps even reconnect with ¥137.
Technical expectation:
The weekly and daily timeframes show buyers may strive to make contact with weekly resistance at ¥137.23. As such, the reaction seen from the current H4 trendline resistance may steady from ¥134 on the H1 as dip-buyers enter the market, in line with the higher timeframe’s direction.
GBP/USD
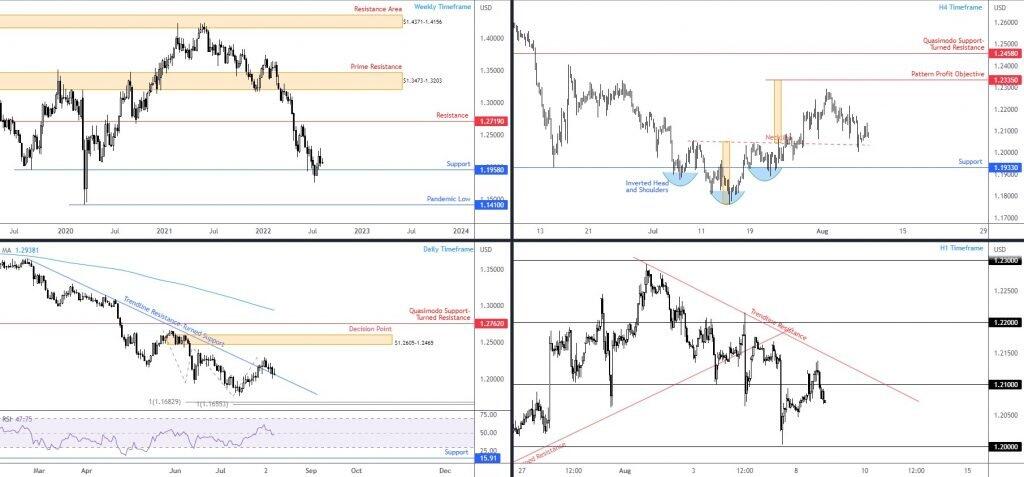
The British pound wrapped up Monday off best levels against the US dollar, unable to garner much of a floor from the daily timeframe’s trendline resistance-turned support, taken from the high $1.3639. Visible alongside the daily chart’s relative strength index (RSI) venturing below its 50.00 centreline (negative momentum), any upside from the aforementioned trendline support is likely to be feeble. Couple this with the weekly timeframe’s support level at $1.1958 failing to ignite much bullish pressure in recent weeks, in addition to the trend facing south since the early months of 2021, sterling clearly echoes a strong bearish vibe.
Across the page on the H4 timeframe, H4 action did manage to discover some support from the inverted head and shoulders pattern ($1.1876; $1.1760; $1.1890) neckline (from the high $1.2056). This follows a near-test of the pattern’s take-profit level from $1.2335 last week. However, in light of the soft support observed on the higher timeframes, traders are urged to pencil in support at $1.1933 in the event we pursue deeper water.
Meanwhile on the H1 timeframe, a rather decisive whipsaw above $1.21 was seen on Monday, movement missing trendline resistance, drawn from the high $1.2293, by only a handful of pips. Attention is now directed back towards $1.20.
Technical expectation:
According to the four charts analysed, sellers appear to have the upper hand right now. Consequently, H1 price cementing position south of $1.21 is a reasonable scenario, targeting the $1.20 region.
Author

Aaron Hill
FP Markets
After completing his Bachelor’s degree in English and Creative Writing in the UK, and subsequently spending a handful of years teaching English as a foreign language teacher around Asia, Aaron was introduced to financial trading,


