Majors technical outlook
EUR/USD:
Weekly timeframe:
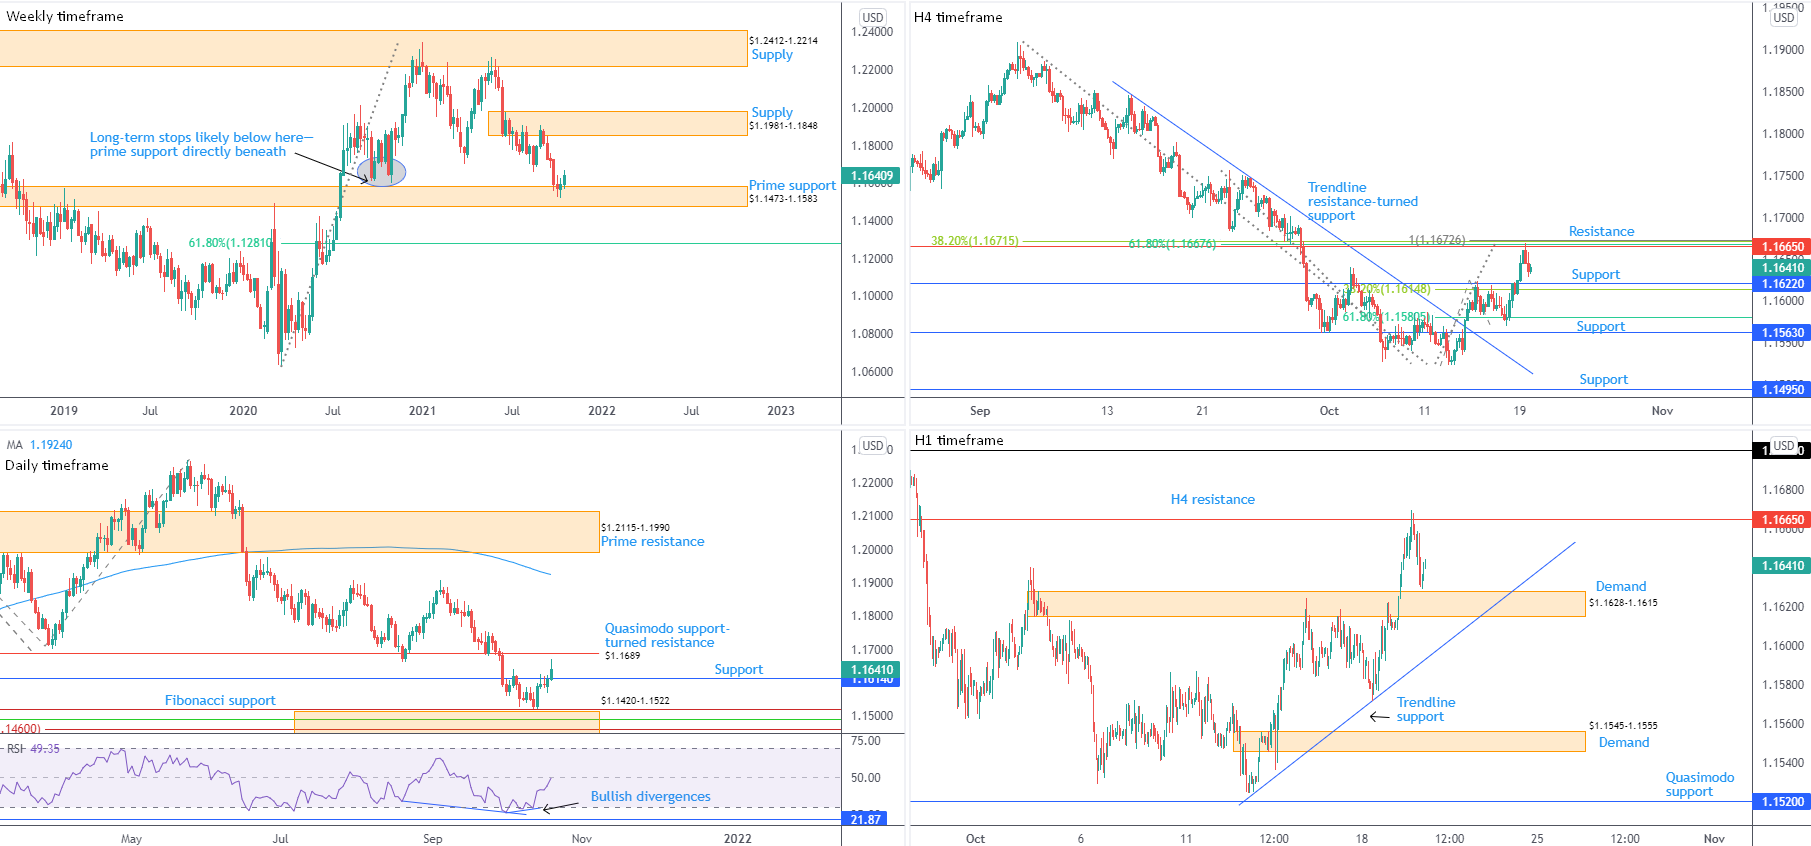
Making their way out of prime support at $1.1473-1.1583, buyers marginally have the upper hand right now. This is potentially fuelled on the back of long-term sell-stops tripped beneath lows at $1.1612 (2020). $1.1981-1.1848 supply is recognised as the next upside objective on this scale.
In the event buyers fail to agree higher prices, south of current support shines the technical spotlight on a 61.8% Fibonacci retracement at $1.1281.
Daily timeframe:
Resistance from $1.1614 came under fire Tuesday and was overthrown, elbowing Quasimodo support-turned resistance at $1.1689 in the spotlight.
Technicians will note the relative strength index (RSI) is on the doorstep of the 50.00 centreline, with a break north of here informing traders that average gains exceed average losses.
In terms of trend, sentiment has favoured downside since June.
H4 timeframe:
Resistance from $1.1665 made an entrance on Tuesday. Reinforced by a 61.8% Fibonacci retracement at $1.1668, a 38.2% Fibonacci retracement at $1.1672 and a 100% Fibonacci projection at $1.1673, sellers came in from this area and landed the unit within range of support at $1.1622.
Common downside objectives after testing a 100% Fibonacci projection resistance—essentially an AB=CD pattern—fall in at the 38.2% and 61.8% Fibonacci retracement levels derived from legs A-D. In this case, the 38.2% Fibonacci level is at $1.1615 and the 61.8% Fibonacci level comes in from $1.1581.
H1 timeframe:
H4 resistance noted above at $1.1665 guided H1 candles back to lows just ahead of a supply-turned demand zone at $1.1628-1.1615 on Tuesday. This area intersects with trendline support, taken from the low $1.1525, and houses H4 support from $1.1622, as well as the H4 timeframe’s 38.2% Fibonacci retracement at $1.1615 representing the lower edge of the demand.
Beyond the noted H4 resistance, $1.17 calls for attention.
Observed Technical Levels:
Based on recent movement, the H1 timeframe’s demand area at $1.1628-1.1615 commands technical confluence. Sharing chart space with a H1 trendline support, two H4 support levels and set just a touch north of daily support from $1.1614, $1.1628-1.1615 is an area that could welcome a bullish phase if tested.
AUD/USD:
Weekly timeframe:
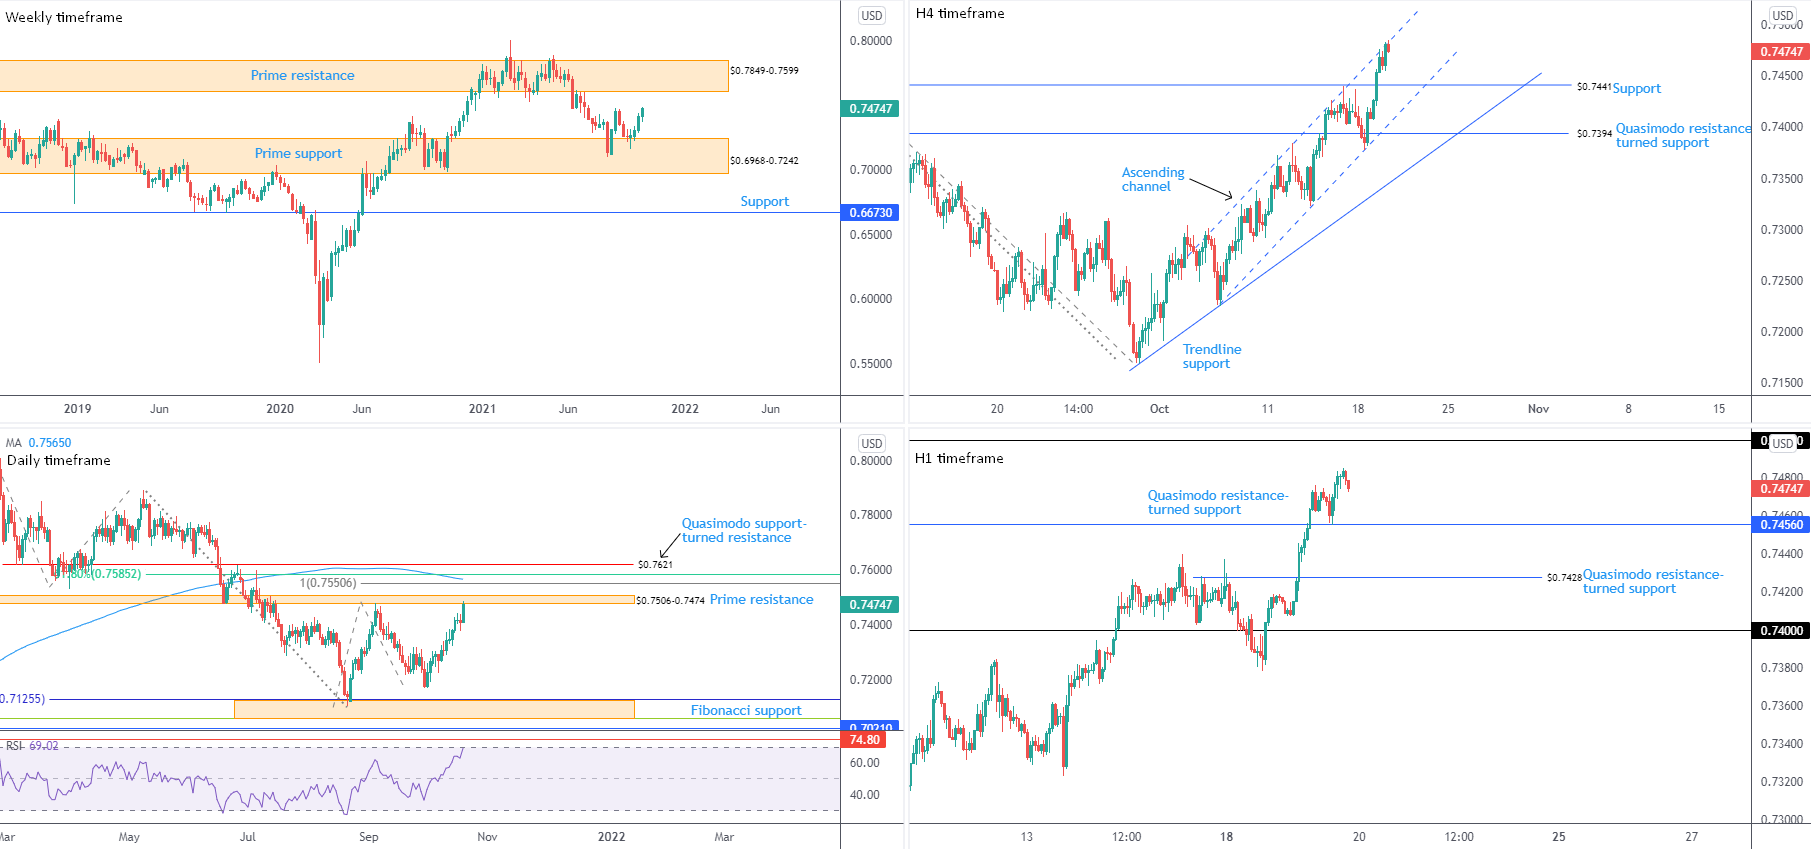
AUD/USD bulls continue to pursue higher levels, following September’s test of prime support from $0.6968-0.7242. Prime resistance at $0.7849-0.7599 represents a reasonable target.
Trend studies on the weekly scale show we’ve been higher since early 2020. Consequently, the response from $0.6968-0.7242 might be the start of a dip-buying attempt to join the current trend.
Daily timeframe:
Prime resistance at $0.7506-0.7474 greeted price movement on Tuesday, drawn into the fight after Tuesday’s one-sided 1.0 percent advance.
Technically, this is an interesting area.
Arranged a whisker south of Quasimodo support-turned resistance at $0.7621, you will note this horizontal line joins closely with the 200-day simple moving average at $0.7565, as well as a 61.8% Fibonacci retracement at $0.7585 and a 100% Fibonacci projection at $0.7551. Between $0.7621 and $0.7551, you may also acknowledge the area is fastened to the lower boundary of weekly prime resistance mentioned above at $0.7849-0.7599.
The relative strength index (RSI) is crossing swords with overbought territory, with indicator resistance at 74.80 perhaps holding enough gas to slow upside momentum.
H4 timeframe:
The technical landscape out of the H4 chart has candle action shaking hands with channel resistance, extended from the high $0.7385. Should the latter inspire a retracement, support from $0.7441 and channel support, drawn from the low $0.7226, could make its way into view.
Continued interest to the upside directs attention to a resistance zone made up of a 100% Fibonacci projection at $0.7543 and a 1.27% Fibonacci extension at $0.7561.
H1 timeframe:
US hours addressed Quasimodo resistance-turned support from $0.7456; session highs of $0.7486 were subsequently discovered before marginally paring upside into the closing candles. $0.75 represents potential resistance on this timeframe should the current pair extend recovery gains.
H4 support from $0.7441 is visible directly beneath $0.7456 on the H1, followed by H1 Quasimodo resistance-turned support coming in at $0.7428.
Observed Technical Levels:
Bullish strategies could see the daily timeframe’s prime resistance at $0.7506-0.7474 throw a spanner in the works. Nevertheless, buying out of the weekly timeframe’s prime support at $0.6968-0.7242 exhibits scope to approach prime resistance at $0.7849-0.7599. With that in mind, interested buyers may still emerge from between H4 support at $0.7441 and H1 support from $0.7456 if tested.
USD/JPY:
Weekly timeframe:
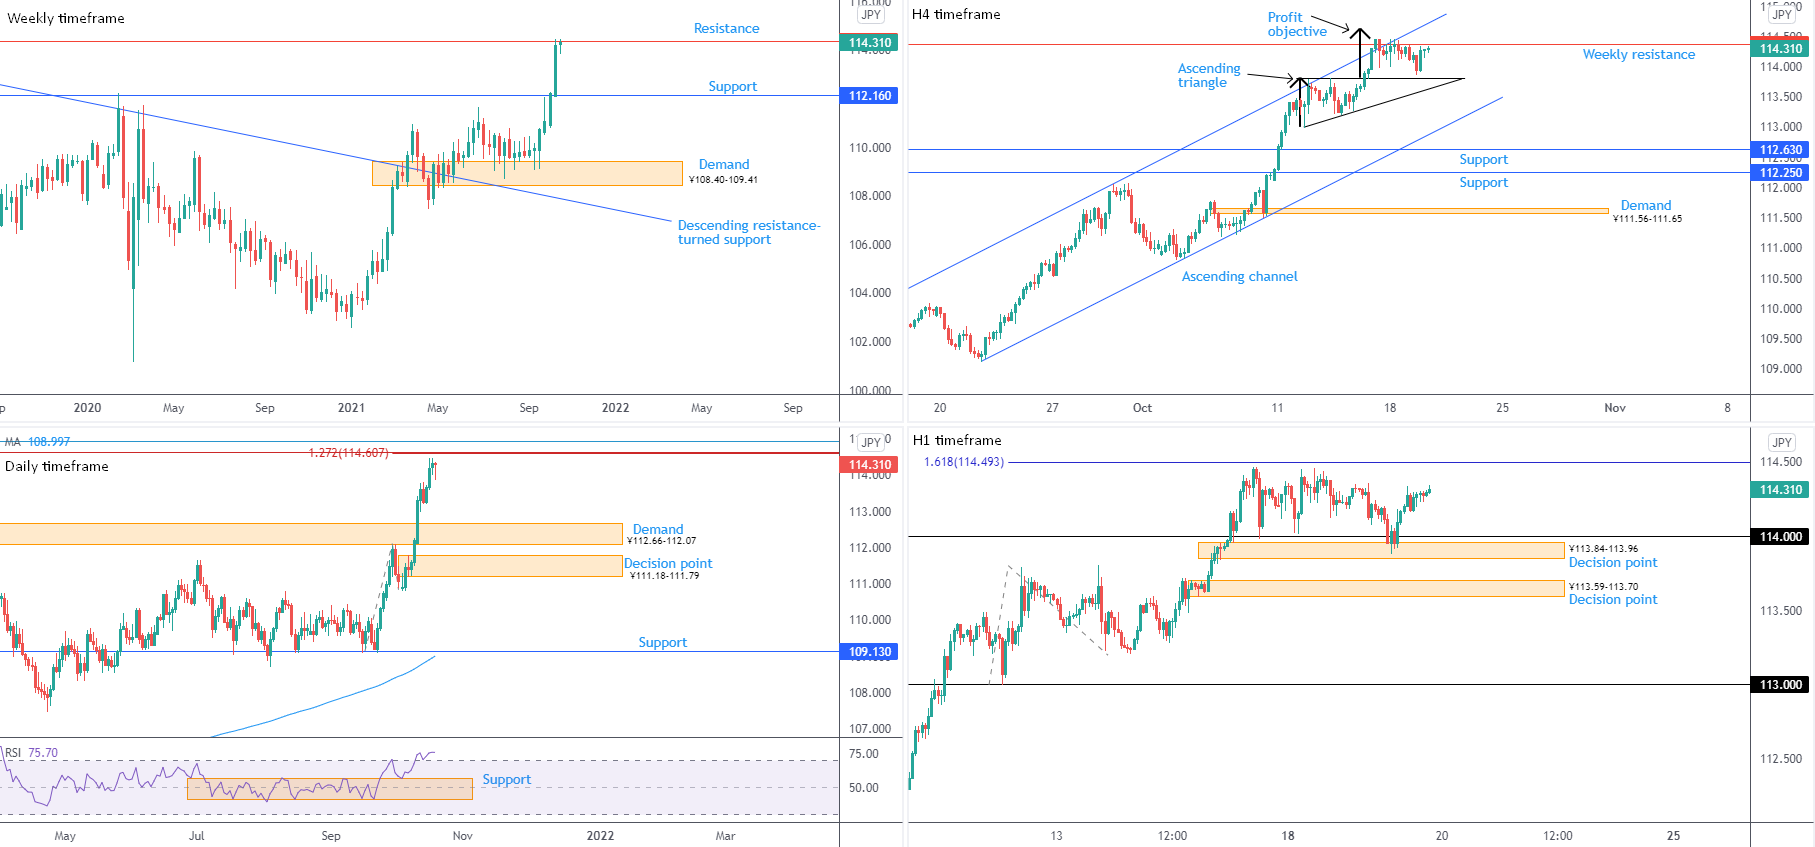
Nestled at the underside of resistance from ¥114.38, USD/JPY registered its sixth consecutive bullish close last week and touched a three-year peak of ¥114.47.
Although current price threatens to form fresh highs, a decisive reaction from resistance sets the stage for bringing in support at ¥112.16.
In terms of trend, we’ve been advancing since the beginning of this year.
Daily timeframe:
Despite establishing another reasonably narrow range between ¥114.35 and ¥113.88, Tuesday concluded considerably off session lows, south of a Fibonacci cluster. Made up of two 1.272% Fibonacci projections at ¥114.63 and ¥114.61, together with a deep 78.6% Fibonacci retracement at ¥114.94, this area, along with weekly resistance highlighted above at ¥114.38, is a potential headwind for the currency pair.
From the relative strength index (RSI), following support emerging from 56.85 (prior range resistance), the indicator’s value continues exploring overbought space. However, with the trend facing northbound this year, overbought signals should be viewed in this context.
H4 timeframe:
Following Friday’s break above the upper limit of an ascending triangle (low: ¥113 high: ¥113.79 [generally viewed as a bullish continuation structure]), price has spent subsequent sessions within touching distance of reaching the formation’s profit objective (thick black arrows) at ¥114.64. Adding to this, technicians will note that weekly resistance is involved at ¥114.38, together with nearby H4 channel resistance, extended from the high ¥112.05.
Holding beneath the aforementioned resistances points to a retest of the upper side of the ascending triangle, with additional selling interest directing light towards channel support, pencilled in from the low ¥109.12. Alternatively, scaling higher pulls daily resistance in the frame between ¥114.94 and ¥114.61.
H1 timeframe:
The ¥113.84-113.96 decision point put in an appearance going into London on Tuesday, welcoming a whipsaw below the ¥114 level. Subsequent upside throws light on a 1.618% Fibonacci projection coming in at ¥114.49.
Observed Technical Levels:
Weekly resistance at ¥114.38 deserves mention, as does the daily timeframe’s Fibonacci cluster between ¥114.94 and ¥114.61. Consequently, profit taking could eventually materialise between ¥114.94 and ¥114.38.
In similar fashion to the bigger picture, a healthy cocktail of resistance is evident on H4 and H1 timeframes. Between the H4 ascending triangle profit objective at ¥114.64, the H4 channel resistance and the H1 1.618% Fibonacci projection at ¥114.49, traders have clear short-term resistance to work with within the higher timeframe resistance zone noted above between ¥114.94 and ¥114.38.
GBP/USD:
Weekly timeframe:
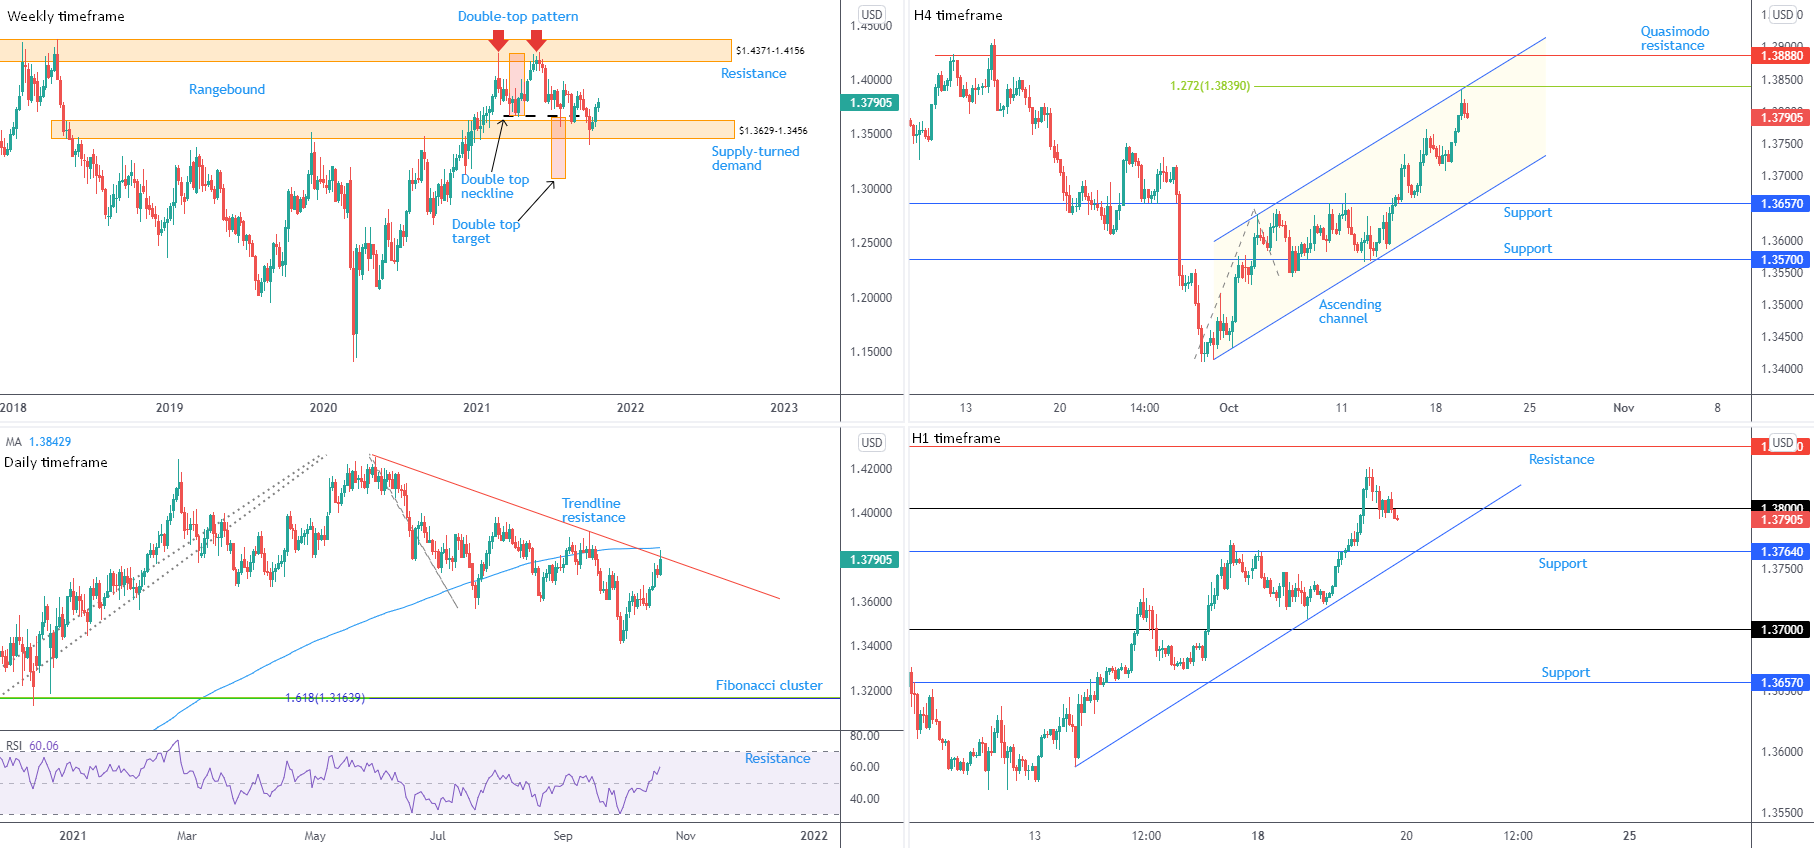
While late September probed the lower wall of supply-turned demand at $1.3629-1.3456, the first half of October has entertained a bullish atmosphere, with last week’s session climbing 1.0 percent.
While we cannot rule out the possibility of further upside, technical elements suggest sellers could eventually strengthen their grip. Not only did price drop beneath $1.3629-1.3456, the unit also closed below a double-top pattern’s ($1.4241) neckline at $1.3669.
The double-top pattern’s profit objective—measured by taking the distance between the highest peak to the neckline and extending this value lower from the breakout point—sits around $1.3093. Conservative pattern sellers are likely to pursue a candle close beneath $1.3629-1.3456 before pulling the trigger.
Daily timeframe:
Helping to discourage additional buying in this market is trendline resistance, taken from the high $1.4250, and the 200-day simple moving average at $1.3843, recently entering play. The combination of the two offers powerful confluence.
The relative strength index (RSI) secured position above the 50.00 centreline last week, with the indicator currently eyeballing overbought space.
H4 timeframe:
Converging with the daily timeframe’s trendline resistance is H4 channel resistance, etched from the high $1.3640, and a 1.272% Fibonacci extension at $1.3839.
North of here, Quasimodo resistance is seen at $1.3888, while below technicians are likely watching channel support, taken from the low $1.3415.
H1 timeframe:
Tuesday’s London morning session observed price overwhelm selling interest around $1.38, reaching a high of 1.3834 as we moved into US trading. This brought with it a retracement, erasing a portion of earlier gains and dipping a toe back under the psychological level.
Trendline support, pencilled in from the low $1.3588, is seen as the next downside target on this timeframe, a base intersecting with support at $1.3764.
Observed Technical Levels:
GBP/USD continues to reflect a bearish climate.
The daily timeframe testing trendline resistance, the H4 timeframe also testing a channel resistance and a Fibonacci projection level at $1.3839, and the H1 timeframe recently pursuing space below $1.38 could see a bearish scenario unfold to at least H1 support from $1.3764.
Author

Aaron Hill
FP Markets
After completing his Bachelor’s degree in English and Creative Writing in the UK, and subsequently spending a handful of years teaching English as a foreign language teacher around Asia, Aaron was introduced to financial trading,


