Major markets looking cautious ahead of FOMC decision

Market Overview
Market sentiment is beginning to recover following the oil price shock from the attacks on the Saudi oil refinery at the weekend. The announcement that Saudi production would be back up and running again sooner than anticipated has dragged the oil price back and unwound some of the safe haven positioning. So quickly, focus is turning to today’s announcement from the Federal Reserve. Whilst Fed funds futures pricing has dropped in recent days (currently just 56% probability of a -25bps cut on CME Group FedWatch) consensus is still calling for a rate cut. Although Powell called the previous rate cut a “mid-cycle adjustment” it would still be a surprise if the Fed did not cut rates this meeting. However, the Fed is still in a wait and see mode with the trade dispute. The domestic economy is ticking along OK, but the trade dispute cycle is in a phase of hope (although we have been here several times before and it always ends in frustration). Dissent is also present on the FOMC with hawks Rosengren and George likely to be steadfast against another cut. So there has to be a chance that the Fed does not go ahead with a cut today, something that rate futures markets are telling us. The FOMC statement will be key and also the dot plots for the remainder of 2019 and into 2020. Markets are predictably cautious but interestingly the dollar has not strengthened as yields have risen in the past couple of weeks. This suggests the dollar performs well in a lower risk environment still.

Wall Street closed with decent gains (S&P 500 +0.3% at 3006) but US futures are -0.2% today. Asian markets have been a shade lower with the Nikkei -0.2% and Shanghai Composite +0.2%. In Europe the caution is also there with FTSE futures and DAX futures both -0.1%. In forex, there is a very slight air of USD strength in front of the FOMC decision, with AUD and NZD slipping more than most hinting at risk aversion. In commodities, the dollar strength is a drag on gold and silver, whilst oil is finding stability after a couple of days of wild moves.
The Fed is foremost in traders’ minds however, UK inflation will still be key on the economic calendar this morning. At 0930BST, UK CPI is expected to show further slip back on headline CPI to grow by +0.5% on the month for August, however expected to drag the year on year data back to +1.9% (from +2.1% in July). Core CPI is expected to grow by +0.7% for the month of August which would also pull year on year core CPI back to +1.8% (from +1.9%). US Building Permits are at 1330BST and are expected to drop slightly to 1.30m in August (from 1.32m in July). Housing Starts are expected to improve to 1.25m in August (from 1.19m in July). EIA weekly Crude Oil Inventories are expected to show another drawdown of -2.9m barrels (-6.9m barrels last week). The main event comes with the FOMC monetary policy decision at 1900BST. The Fed is expected to cut interest rates by -25 basis points to a Fed Funds range of 1.75%/2.00%. Look out also for changes to the dot plots and economic forecasts.
Chart of the Day – EUR/CHF
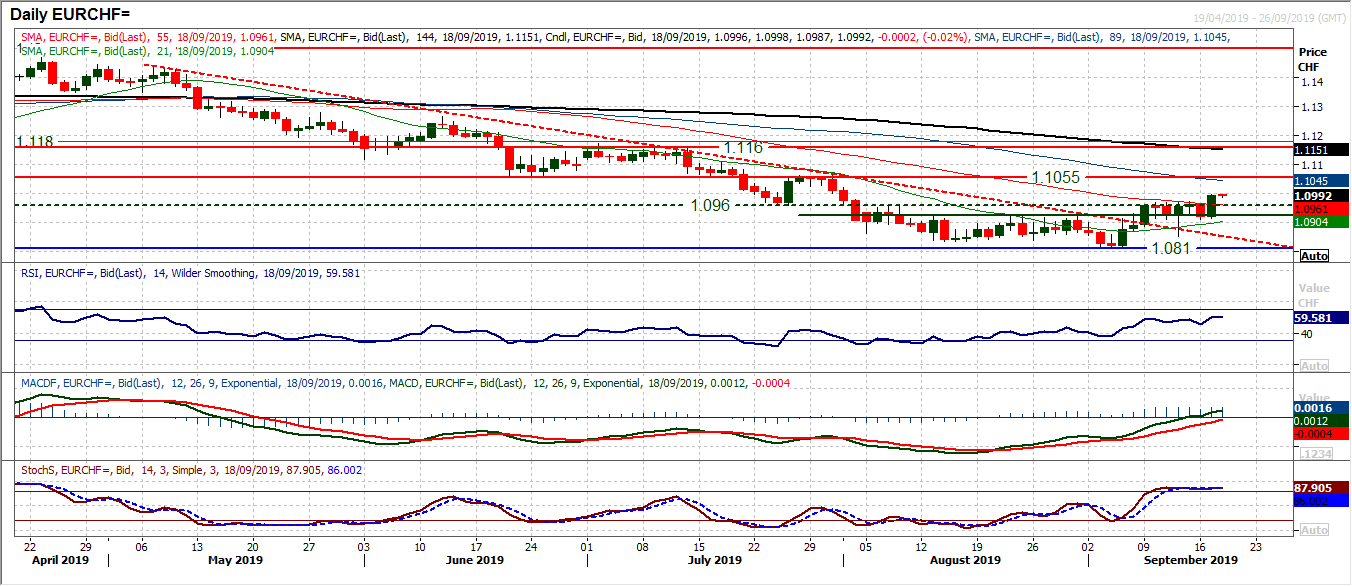
A recovery is building momentum. After over a week of consolidation around an old pivot resistance at 1.0960 with consistent failures to breakout, the market has broken out. A decisive bull candle formed yesterday with a closing breach above 1.0960 to confirm that a bull recovery is on track. An original base pattern completed above 1.0930 to imply a target area of 1.1050, however, the pivot has been restrictive, until now. Momentum is building well now, with the RSI around four month highs, MACD lines close to pulling above neutral and Stochastics strongly positioned. The 21 day moving average has been a broad basis of resistance for months but has recently turned higher and is now becoming a basis of support. Furthermore, yesterday’s breakout also took the market above the 55 day moving average for the first time since May. We now see a buy zone between 1.0930/1.0960 for the bulls to buy into weakness. The next real resistance is the pivot at 1.1055 which is a shade above the implied base target. It would now need a close below 1.0910 support to abort the recovery.
EUR/USD
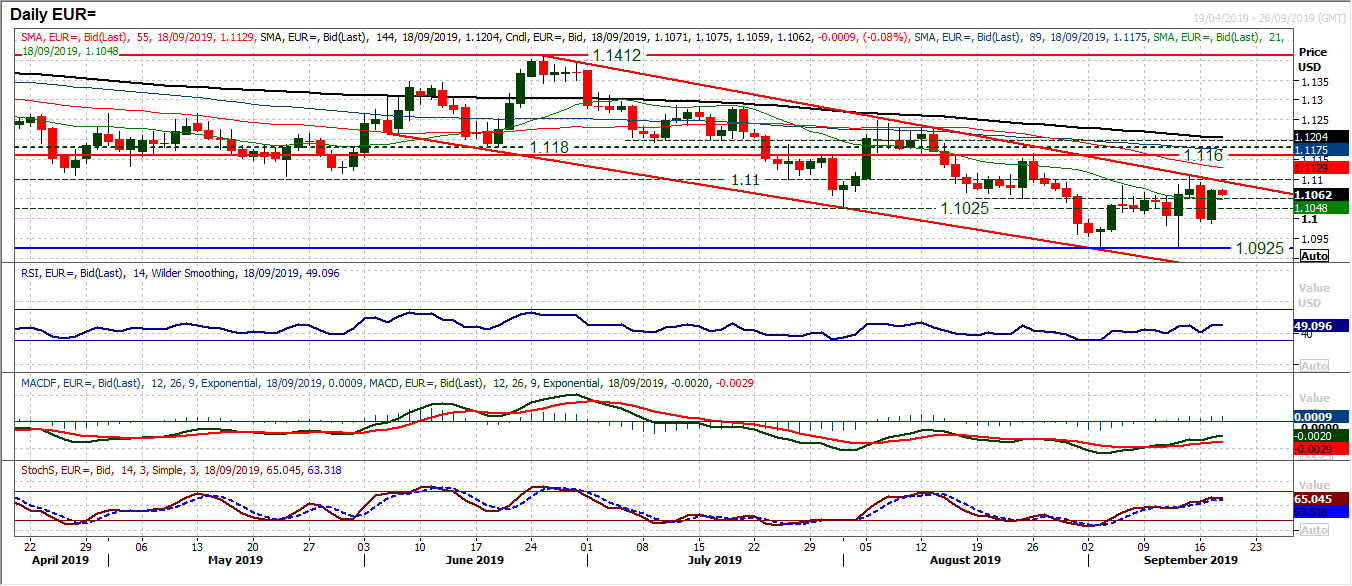
It seems as though the euro sentiment has shifted in the wake of the ECB decision. A renewed QE drive, but the euro is still in favour. As broad market sentiment improved following a sharp drop in the price of oil, traders turned away from the dollar again. The euro has come out well from this. A big bull rebound candle has undone much of Monday’s sharp sell-off and once more seems to be eyeing the channel resistance. The question is now how the euro bulls cope around $1.1100, a level which has in recent weeks been its undoing. The overhead supply of the old lows of April through to July are coming back in as resistance now around the top of the downtrend channel. Momentum indicators have been improving in the past couple of weeks, but RSI is again around 50 where it has previously struggled. Given the tendency for the euro rallies to fail within the channel we treat this rally with caution. The resistance of the post-ECB high at $1.1110 is very important now. A closing break would be a big signal for the bulls. However, if the market again begins to fade this rally then this period of choppy sideways trading of the past two weeks will simply continue.
GBP/USD
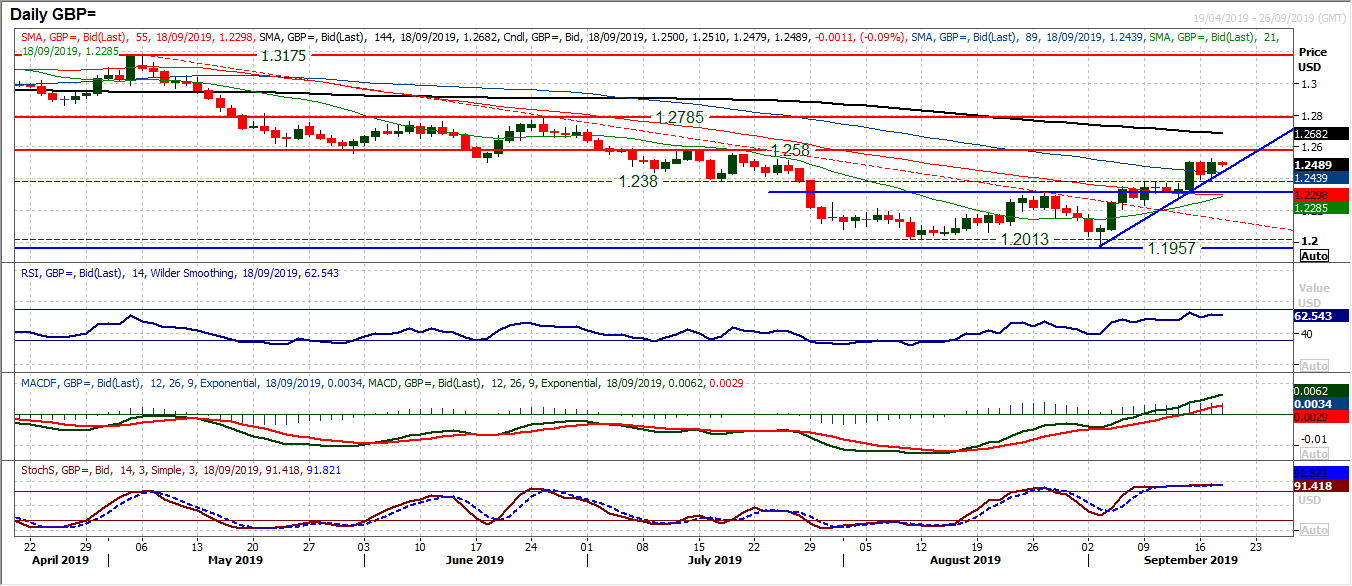
The Cable bulls are using the support of a two week uptrend to pull the market higher, posting a series of higher lows in the recovery. The technicals are certainly backing the continuation of this move, with the RSI holding steady in the low 60s, MACD lines advancing solidly above neutral now and the Stochastics strongly configured. This all points to buying into weakness in this rally. The breakout above $1.2305 completed a base pattern that implies a recovery towards $1.2600, with the latest move above $1.2380 now being a pivot support. Yesterday’s latest positive candle was a positive reaction to Monday’s slip and shows confidence of the sterling bulls now. The two week uptrend is at $1.2440 today. The next resistance of the July highs at $1.2580 is certainly within reach. The main caveat is the very changeable UK political situation regarding Brexit. However, for now we are happy to go with this Cable recovery. Key support is at $1.2280 below which is an outlook changer now.
USD/JPY
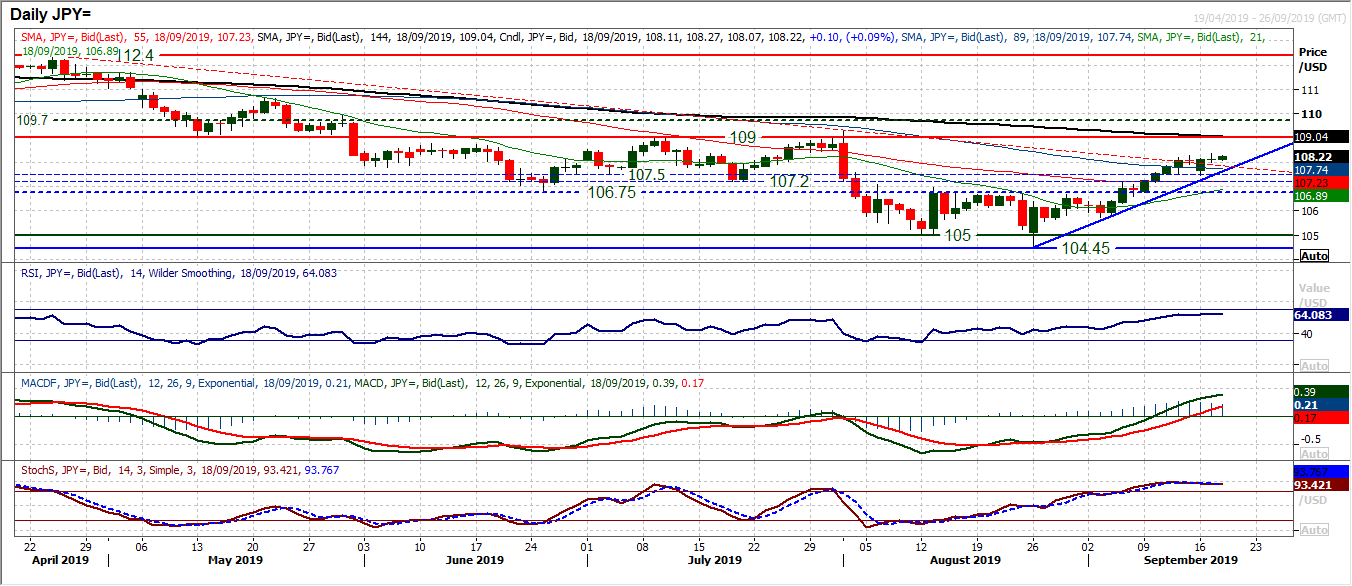
The move out of the yen continues with the ongoing recovery trend on Dollar/Yen. In the past three weeks there has been a consistent run of higher lows and higher highs, whilst positive candlesticks are increasingly commonplace as the buyers win the day time and again. A couple of doji candlesticks in the past three sessions perhaps hint at a degree of caution, however, this could be due to the upcoming Fed and BoJ meetings. Technically though, we are still confident to back the bulls here. Using the breakout band 106.75/107.50 as a basis of support, the uptrend now comes in at 107.60 today. Another intraday move to a six week high continues to edge the market higher towards a test of the 109.00 next key resistance. Momentum indicators maintain their positive configuration with RSI in the 60s, MACD lines rising above neutral and Stochastics bullish above 80. All suggests buying into weakness. The FOMC will create some volatility but we continue to expect Dollar/Yen higher. A close below 107.50 would be disappointing now, with below 106.75 being an outlook changer.
Gold
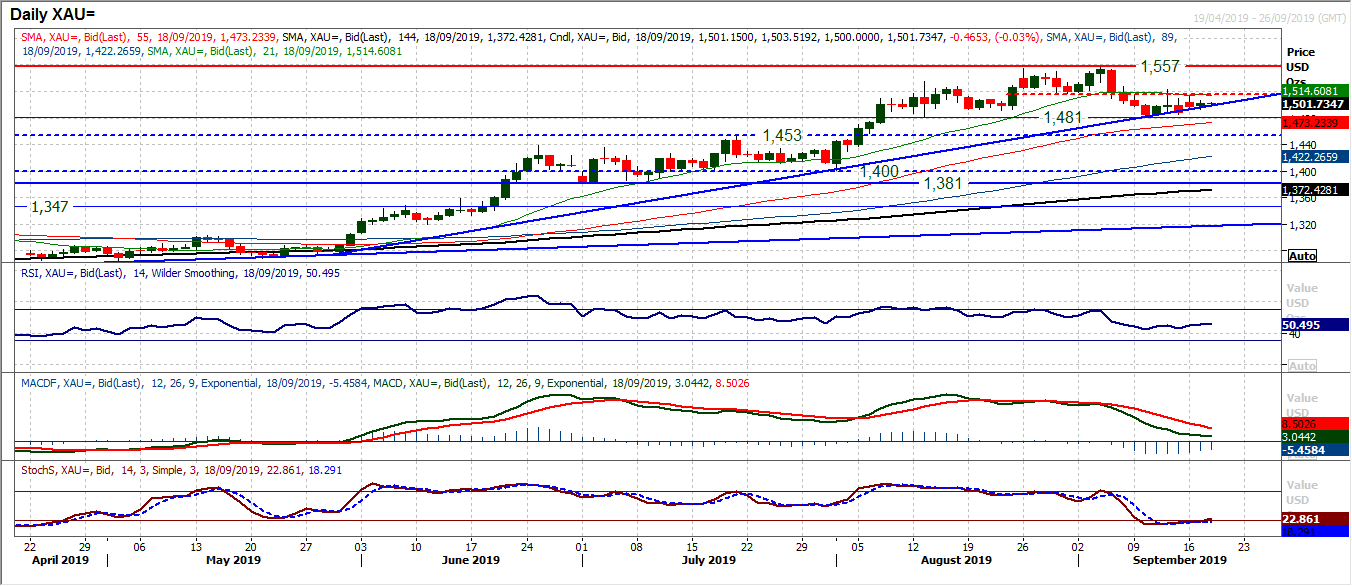
An increasingly neutral outlook continues to develop on gold. There are plenty of concerns we now have on the bull front, however, whilst the market holds on to the support at $1481 then this recent run of trading between $1481/$1557 would simply turn out to be another broad consolidation. However, there is a sense that the pedestal the bulls are on is creaking now. Having broken below $1517 (the previous minor reaction low), the market is being limited by the now falling 21 day moving average (today at $1515). There is a far less positive configuration on momentum, although there is a sense of relief for the bulls that the RSI is settling around 50 and MACD lines just unwinding towards neutral. The support of a four month uptrend could well succumb to this consolidation but is currently broadly intact (today at $1499). Between $1481 and $1517 we are neutral, becoming more positive on a close above $1517. However, given the far less positive configuration on several indicators, we would turn corrective if the market were to breach $1481 on a closing basis. The completion of a top pattern would then imply around $75 of downside target.
WTI Oil
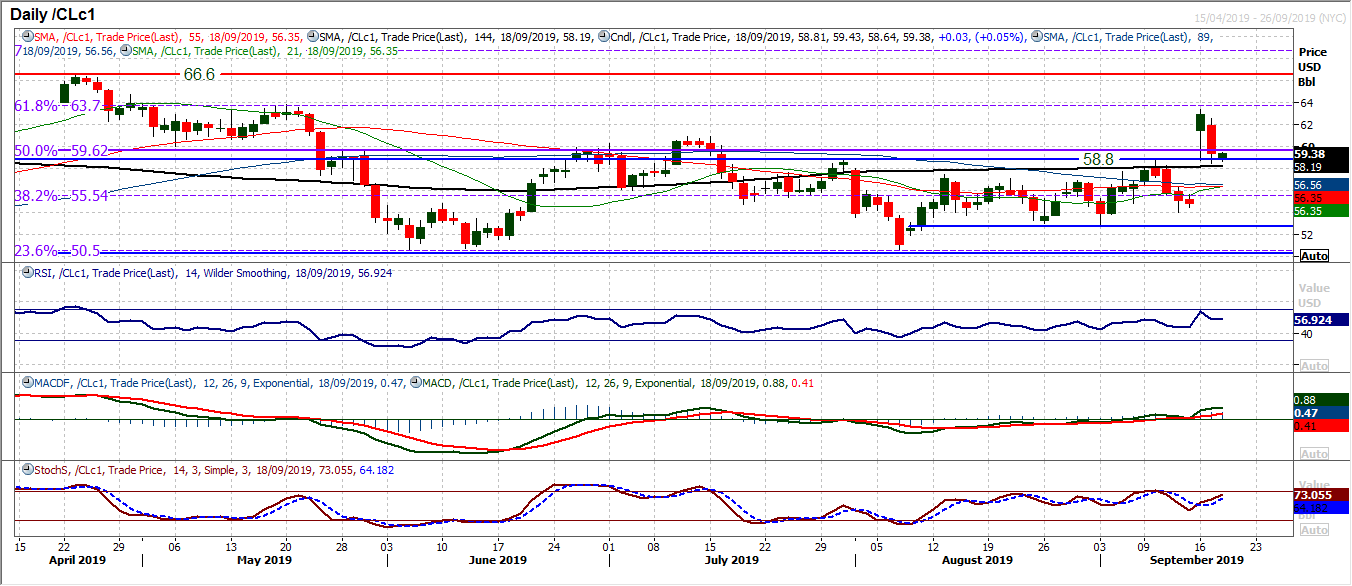
The oil price remains very volatile following the supply shock of the weekend. Yesterday’s -5.6% decline came as Saudi officials suggested that the supplies would be rolling again sooner than expected. WTI has dropped back and interestingly has begun to settle this morning around the technical breakout of the previous range highs at $58.80. There is a band of support from these old August highs $57.45/$58.80 an if the bulls can begin to see these as supportive then there is a chance of a new basis of a range formation. However, this supply shock may not last too long and the move higher is still likely to have more to fade. The huge gap is still wide open at $55.70. It is still difficult to use technicals with high conviction during this time where the market is so sensitive to newsflow. Despite this, $58.45 is initially support from yesterday’s low, but if this is breached then the market is likely to continue on its drift unwind.
Dow Jones Industrial Average
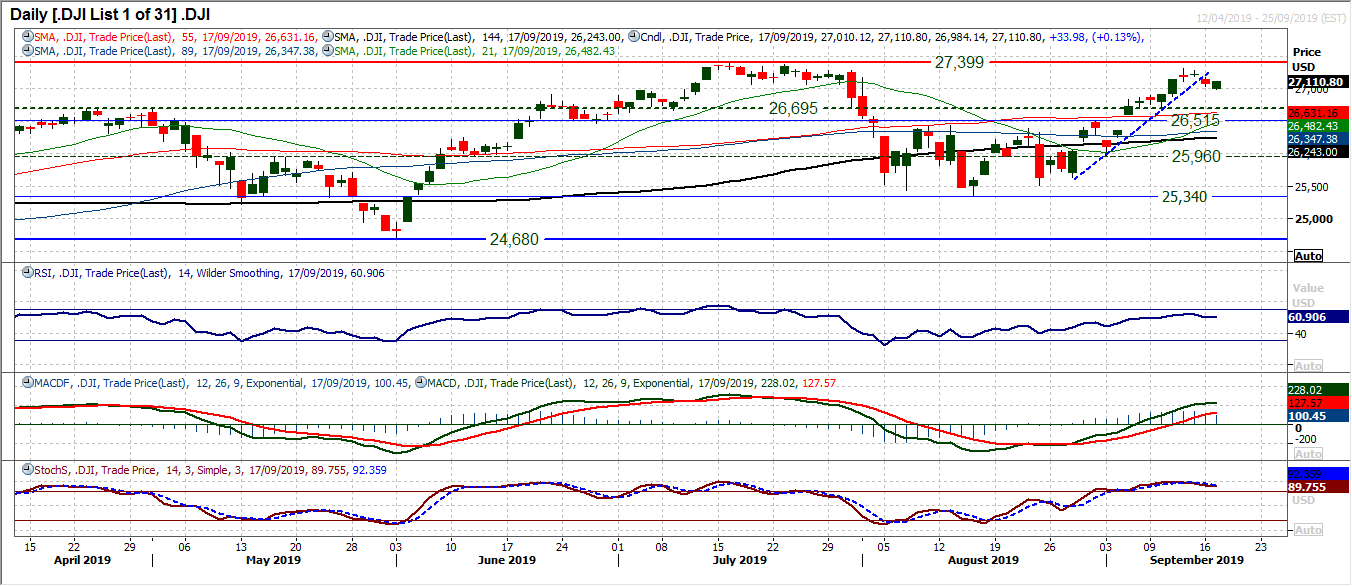
A decent reaction from the bulls during yesterday’s session hints at the prospect that the dip back on Wall Street following the Saudi oil attacks is already past its worst. A mild gain on the session but a candlestick with a close at the high of the day shows the bulls fighting back. The two and a half week uptrend may have been broken, but the positive implications of the market breaking through 26,515/26,695 remain. Momentum indicators are still positively configured with the RSI above 60, Stochastics have rolled over but remain strong above 80 whilst MACD lines are above neutral. Yesterday’s low at 26,965 will now be seen as a near term gauge of support as the bulls look to re-assert themselves. Resistance is at last week’s high of 27,306 which protects the 27,399 all-time high.
Author

Richard Perry
Independent Analyst


