Long Term Outlook for S&P

One of the most useful patterns for traders is my seven move Chaos Clamshell, discussed at http://moneytide.com/hans/institute.asp
This pattern, and it's refinement, the Fractal Of Pi, have helped many traders anticipate where the market may be going next. Mostly, traders use this for shorter term trades, lasting a few days, weeks, or months. But it can be used for longer terms.
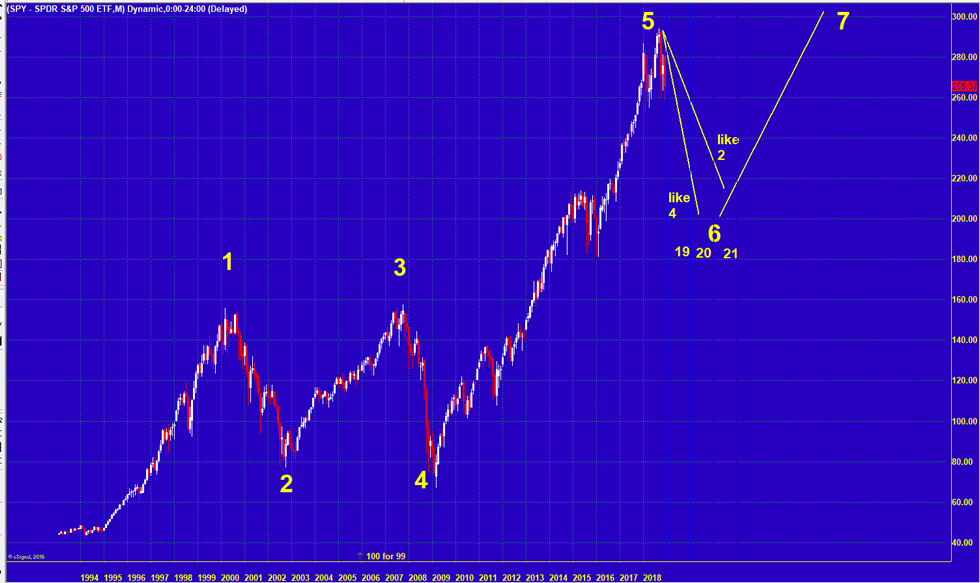
This chart of the SPY covers the period from 1993 to present. It has been clear that this year, 2018, the market has struggled to go higher. This has been very clear since the Fireball Top I identified in early October. That top does look like the end of move 5 on this long term Chaos Clamshell.
Forecasting the move 6 down can be done by looking at the two Bear Markets of move 2 and move 4. If this Bear Market is like 4, it could end about April of 2020. If it is more drawn out, it could last into April 2021. Prices could bottom between 200 and 220 on SPY.
--
This content was published on Dr. Al Larson's Chaos Clinic which you can attend each Friday for free.
Dr. Al Larson has developed a complete Chaos Model of Markets, four unique courses that let you become a Certified Chaos Trader, some very unique eMylar fractal pattern overlays, and tools that permit forecasting individual stocks and markets years in advance. You can also sign up for a free weekly email, and attend a free Chaos Clinic on Fridays. To learn more, click on the author's profile.
Be sure to sign up for the free weekly email!
Author

Dr. Al Larson, PhD
MoneyTide.com
Dr. Al Larson holds a Ph.D. in Electrical and Computer Engineering from the University of Wisconsin. He is a 1964 Distinguished Graduate of the U. S. Air Force Academy.


