Long-Term Home Prices

The last three decades recorded remarkable returns in home prices within most OECD member countries. Nowadays, institutional and retail investors perceive housing as a safe long-term investment. However, they will be most likely disappointed over the next few decades. This write-up discusses long-term evidence that academic research revealed on home prices. It will conclude with an assessment of real estate as an investment portfolio component.
Long-term evidence is not favorable for housing investors with a long-term focus. Historical data shows hardly any inflation-adjusted appreciation of home prices throughout the past centuries. This internationally consistent picture allegedly changes at the beginning of the 1990s. A sharp increase occurred since then, which has been often described as a “hockey stick”.
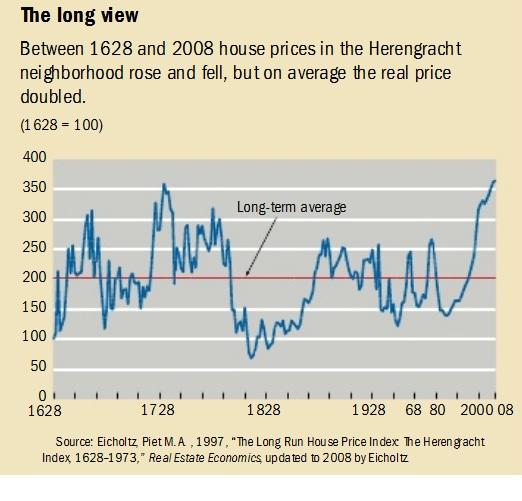
The Herengracht house price index in the chart above is the most extensive history of quality data on house prices and puts today’s price rally into a historical perspective. The index goes back to the year 1628 and tracks well-documented housing transactions in a neighborhood of Amsterdam. It shows that housing prices moved within secular trends, which lasted most often between 10-30 years and oscillated around a long-term average price. A doubling or halving of real prices was common and not exceptional during the past few centuries. More long-term datasets across Europe confirm the Dutch evidence. The second chart shows long-term prices for three other European capitals. All four indices display similar patterns concerning secular cycles as well as the hockey stick shape. Moreover, the data confirms a real price decline from roughly 1900 to 1950 across European capitals.
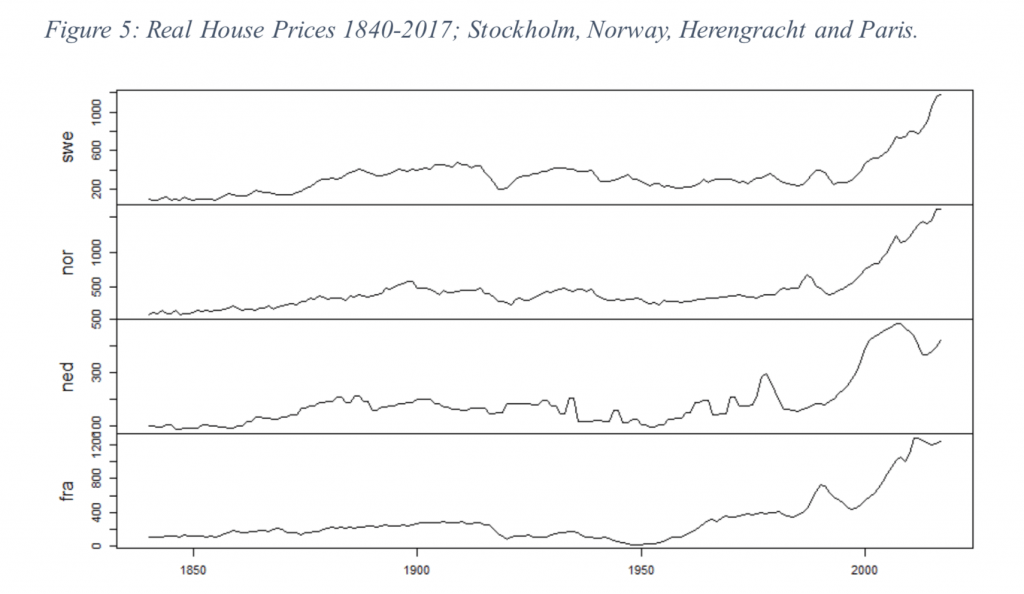
(Source: Rodney Edvinsson, Klas Eriksson, and Gustav Ingman)
A very similar pattern is visible in the United States. The correction into the first half of the last century unfolded not only in Europe but also in the United States. Moreover, U.S. housing experienced a major rally into the Global Financial Crisis of 2007. Subsequently, prices corrected sharply and recovered almost to their pre-crisis highs in inflation-adjusted terms. The third chart in this article shows long-term U.S. home prices versus building costs, population growth, and interest rates.
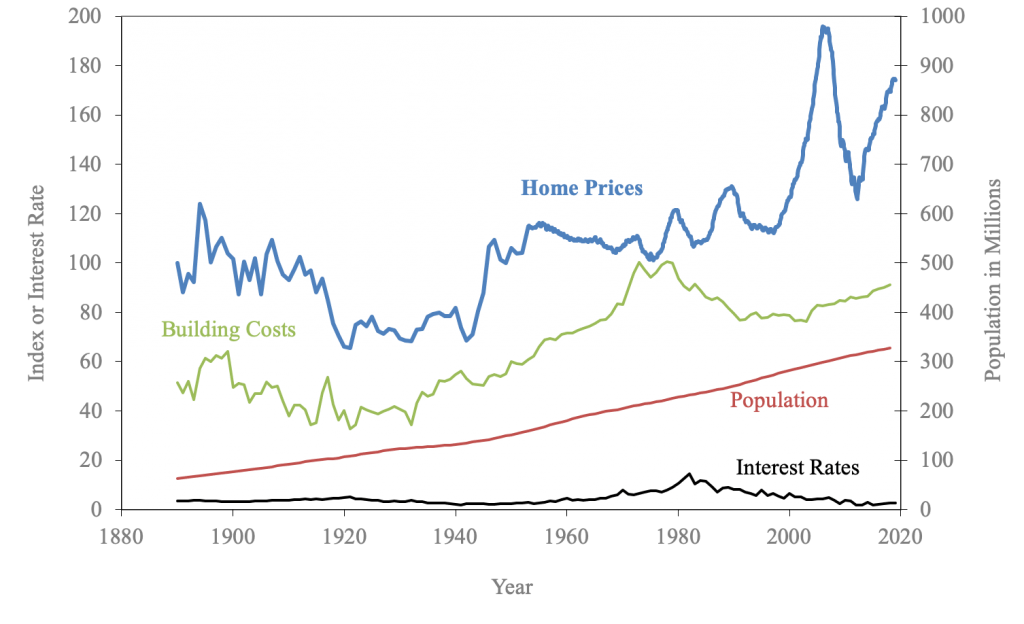
(Source: Professor Robert J. Shiller, Yale University)
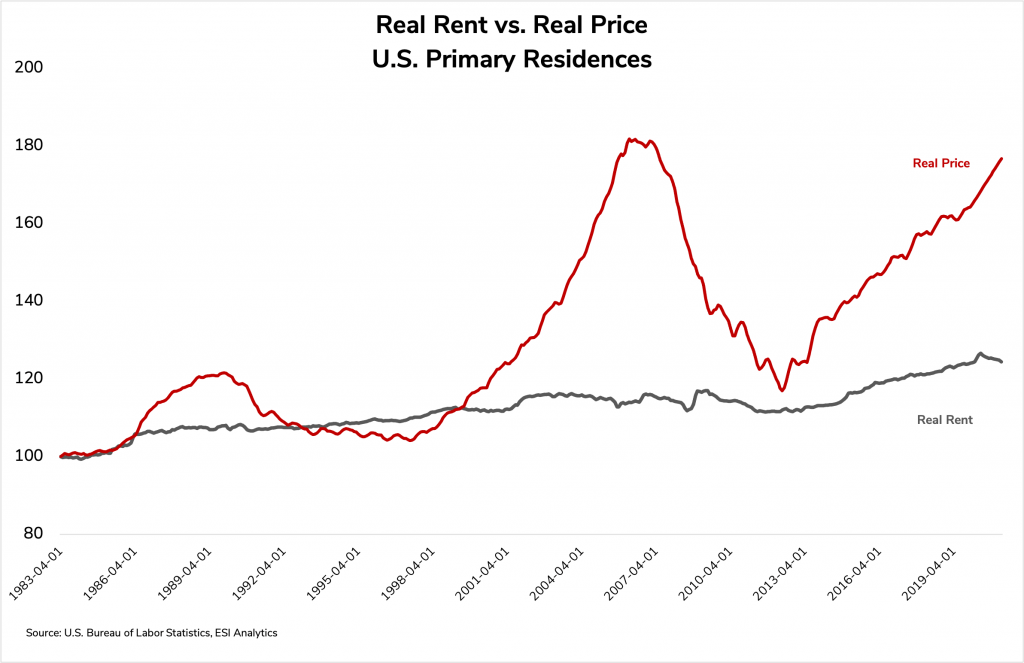
Housing is widely perceived as a solid long-term investment and many do not question its fundamentals. However, fundamentals do not confirm the remarkable price increase over the past three decades. Real rental income has been relatively stable and yields decreased as prices rallied. The red time series in the very last chart below plots U.S. real housing prices versus real rent since the early 1980s. Both indices are adjusted for inflation during that period. It shows that property prices did not increase because of higher rental income. Other fundamentals such as interest rates, building costs, and population growth are additional metrics that pundits quote to justify price increases. However, none of them explained a significant extension of home price gains or losses historically. The rise in housing prices since the 1980s has not been fundamentally driven. When prices decouple from fundamentals, it is most often caused by speculative flows. Such a pattern is similar to other asset classes. However, speculative flows reverse in the other direction eventually. The Dutch data shows five of these instances, which led to significant double-digit corrections.
Long-term historical evidence shows that the appreciation of U.S. property prices is most likely unsustainable. The same result holds for the vast majority of the OECD member countries, which experienced a sharp appreciation in property prices over the past three decades. A passive property investment portfolio will most likely disappoint investors. Those who benefited from strong appreciation in investment properties are most likely best off reducing their housing exposure and considering alternative long-term investments instead.
Interested in more of our ideas? Check out Scienceinvesting for more details!
Author

Science Investing Team
Science Investing


