Since I discovered the Chaos Clamshell pattern in 1990, I have found it to be a most useful pattern for trading. In it's basic form, it is a 7 move complex zig-zag. It shows up on charts ranging from one minute bar charts, to daily, weekly, and even monthly. 

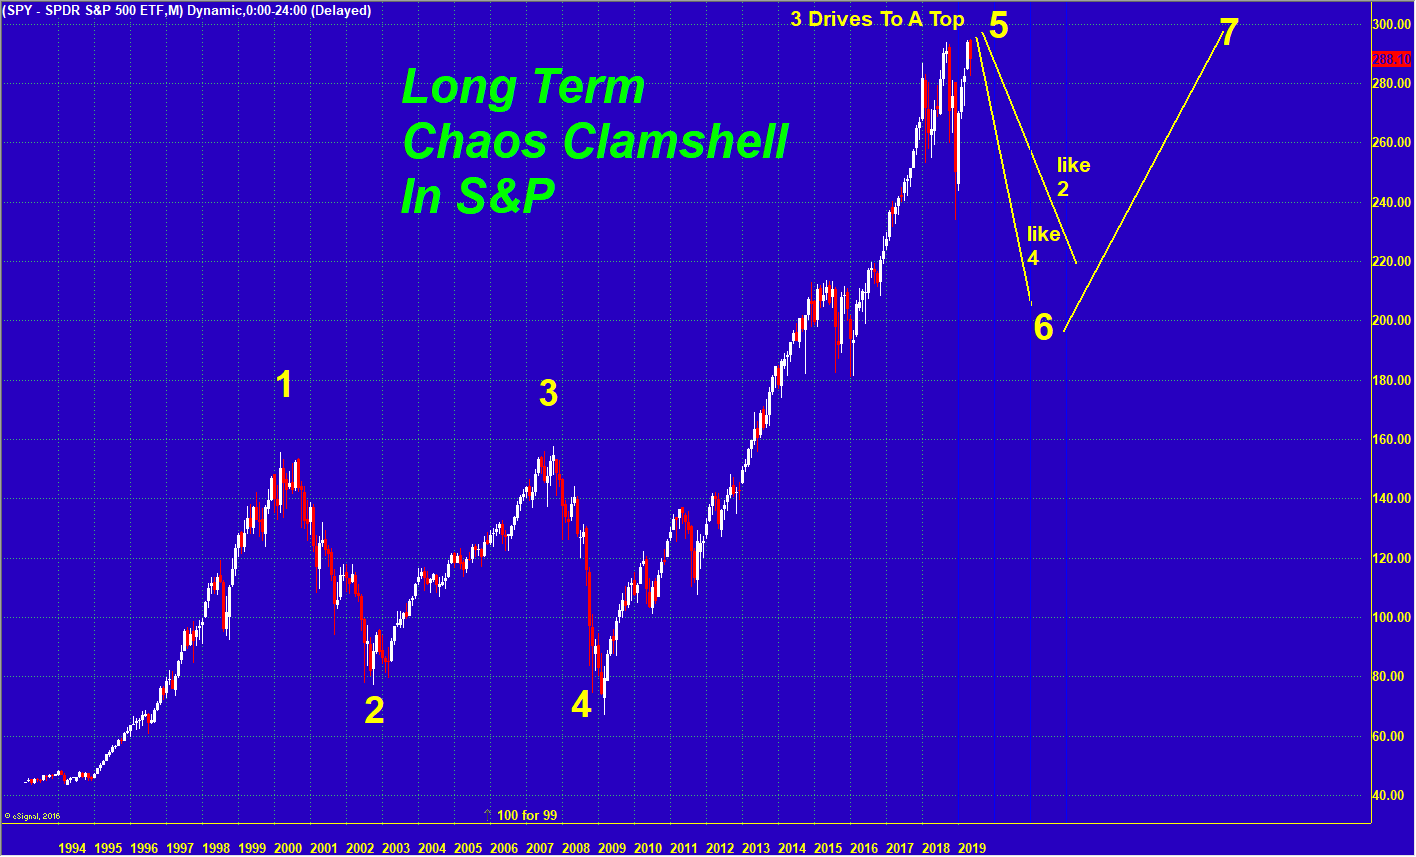
This chart shows the S&P Exchange Traded Fund, SPY since its inception, on a monthly chart. It starts out with moves 1, 2, 3, and 4, forming a base. Move 4 was the Great Recession. 

Move 5 is usually the biggest and fastest move. This is true of the SPY which has risen in a ten year super bull market. Now it looks like that bull is dead. 

In 2018, the S&P make two distinct tops. It has now make a slightly higher top in 2019. This has formed the pattern traders call "Three drives to a top." It is one of the most reliable patterns signaling the end of a move. 

Move 6 and 7 follow move 5. One way to estimate move 6 is to project it as a duplicate of move 2 or 4. That is shown on this chart. It suggests prices in SPY pulling back to 200-220. In the S&P futures, that is 2000-2200.


This content was published on Dr. Al Larson's Chaos Clinic which you can attend each Friday for free.
Dr. Al Larson has developed a complete Chaos Model of Markets, four unique courses that let you become a Certified Chaos Trader, some very unique eMylar fractal pattern overlays, and tools that permit forecasting individual stocks and markets years in advance. You can also sign up for a free weekly email, and attend a free Chaos Clinic on Fridays. To learn more, click on the author's profile.
Be sure to sign up for the free weekly email! 

Information on this page contains forward-looking statements that involve risks and uncertainties. Markets and instruments profiled on this page are for informational purposes only and should not in any way come across as a recommendation to buy or sell in these securities. You should do your own thorough research before making any investment decisions.

Recommended Content


Recommended Content

Editors’ Picks

EUR/USD clings to daily gains above 1.0650

EUR/USD clings to daily gains above 1.0650

EUR/USD gained traction and turned positive on the day above 1.0650. The improvement seen in risk mood following the earlier flight to safety weighs on the US Dollar ahead of the weekend and helps the pair push higher.

EUR/USD News

GBP/USD recovers toward 1.2450 after UK Retail Sales data

GBP/USD recovers toward 1.2450 after UK Retail Sales data

GBP/USD reversed its direction and advanced to the 1.2450 area after touching a fresh multi-month low below 1.2400 in the Asian session. The positive shift seen in risk mood on easing fears over a deepening Iran-Israel conflict supports the pair.

GBP/USD News

Gold holds steady at around $2,380 following earlier spike

Gold holds steady at around $2,380 following earlier spike

Gold stabilized near $2,380 after spiking above $2,400 with the immediate reaction to reports of Israel striking Iran. Meanwhile, the pullback seen in the US Treasury bond yields helps XAU/USD hold its ground.

Gold News

Bitcoin Weekly Forecast: BTC post-halving rally could be partially priced in Premium

Bitcoin Weekly Forecast: BTC post-halving rally could be partially priced in

Bitcoin price shows no signs of directional bias while it holds above  $60,000. The fourth BTC halving is partially priced in, according to Deutsche Bank’s research. 

Read more

Week ahead – US GDP and BoJ decision on top of next week’s agenda

Week ahead – US GDP and BoJ decision on top of next week’s agenda

US GDP, core PCE and PMIs the next tests for the Dollar. Investors await BoJ for guidance about next rate hike. EU and UK PMIs, as well as Australian CPIs also on tap.

Read more

Majors

Cryptocurrencies

Signatures