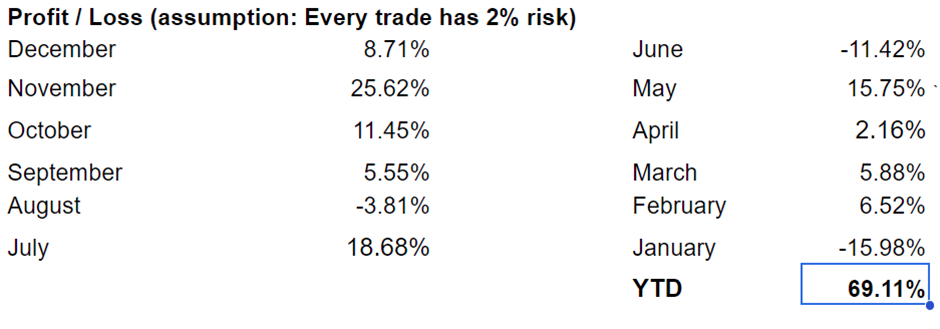
Live trading room performance in 2023 produces 69% return

Last year, our live trading room provides 69% return annually across the 3 groups that we cover.
In Live Trading Room, we scan the market everyday to find any tradable setup. We believe every serious traders need to have a good trading system with specific rules. A complete system must include the following:
1. Conditions to enter into trade. In our system, we can only trade when there’s a bullish or bearish sequence. Our chart visually shows whether there’s a bullish sequence with an up-green tag and bearish sequence with a down red tag.


2. Rule where to enter: Once the condition to trade is present, the system needs to specify where to enter. Our system uses the method of buying/selling correction in 3, 7,or 11 swing. The entry area is always the 100% of the 3 or 7 swing.
3. Rule where to place stop loss. Our system uses 161.8% in 3 or 7 swing as the stop loss level as we believe the third swing in corrective structure should not extend beyond 161.8%. When third swing extends to or beyond 161.8%, it’s usually a sign that it’s a wave 3 and thus the structure is impulsive.
4. Rule where to place target profit: Our system uses the 100% extension of the bullish sequence or bearish sequence as a target profit.
Trading involves patience and discipline to wait for the conditions. Thus why we think trading only 1 or 2 instrument is tough because sometimes conditions to trade do not come for weeks and even months especially in a sideways instrument. That’s also the reason we cover 78 instrument in total in 3 different groups to increase trade chance.
Below is an example of how we won the trade using our system in Group 1. We gave a signal to buy Gold at 2033 on November 30, 2023 last year. Here’s how our journal shows on November 30. The Gold trade is listed at he last row in the journal.
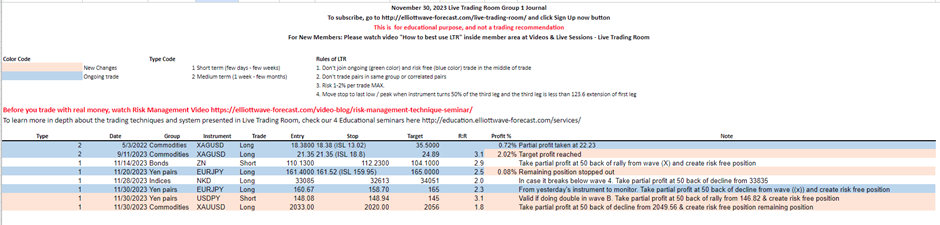
In the journal above, we told our members to buy Gold at 2033, with stop loss at 2020, and target profit 2056. The setup is based on the idea that we have bullish sequence in Gold (green right side tag), and that Gold is pulling back in 3 swing and reaching the 100% extension area as the chart below shows
One hour Gold chart from 30 November 2023
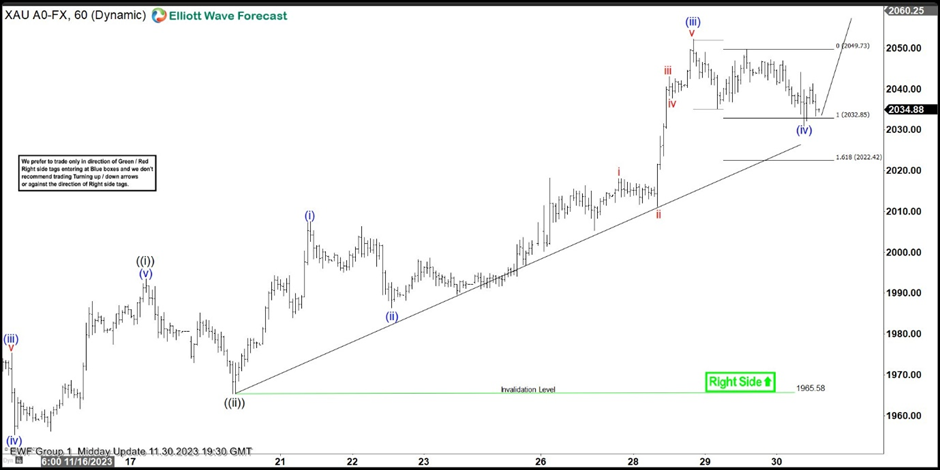
As the 30 November chart of Gold above shows, the metal is pulling back in 3 swing within wave (iv) and reaching the support area of 2022 – 2032 where buyers can appear. There’s also a bullish sequence as indicated by the green tag up. We bought the pullback at 2033 and reached our profit target of 2056 on December 4, 2023 as the 1 hour chart below shows the rally from the buying area.
One hour Gold chart from 4 December 2023
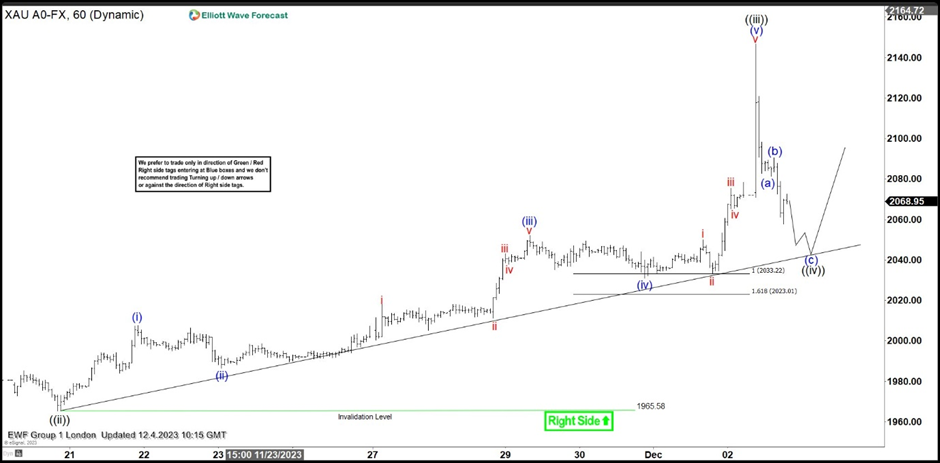
The 1 hour London chart from 4 December above shows Gold rallying strongly higher after reaching the 2023 – 2033 support area. The metal hit our 2056 and continues to spike higher to reach 2148 before finally pulling back.
Author

Elliott Wave Forecast Team
ElliottWave-Forecast.com


