Liquidity event brewing under the surface

The system has some serious vulnerabilites at the current moment and it's important to understand the risks. The vulnerabilities (which I will get to in a second) led me to believe that a sharp correction in equities may begin as early as this past week but that did not happen as equities created new all-time highs, yet again. As always, equities make it seem like nothing is wrong or going to go wrong in the market, but underneath the surface there are some liquidity pressures mounting. What I mean by that is that capital is flowing into the short (cash) end of the yield curve. From 2-year notes to Treasury bills, capital is chasing high quality, liquid assets, forcing the yields to fall on these short-term bond durations. This behavior happens when there is a shortage of liquidity (collateral) in the system, hence the rush to the most liquid assets (T-bills) in the world which are found on the short-end of the US yield curve.
There has been a lot of talk about the 10-year yield and 30-year yield rising, steepening the yield curve to a level not seen since 2015, although a lot of the steepening has to do with the short-end falling. The longer-dated bonds are more sensitive to inflation and growth expectations, and we are seeing those yields rise as expectations of a recovery this year continue to mount. While this may tell us inflation and growth expectations will continue in the near-term, it doesn’t tell us about the collateral (cash) shortage in the system. So, let’s take a quick look at the short (cash) end of the yield curve to get a better idea of what I’m talking about.
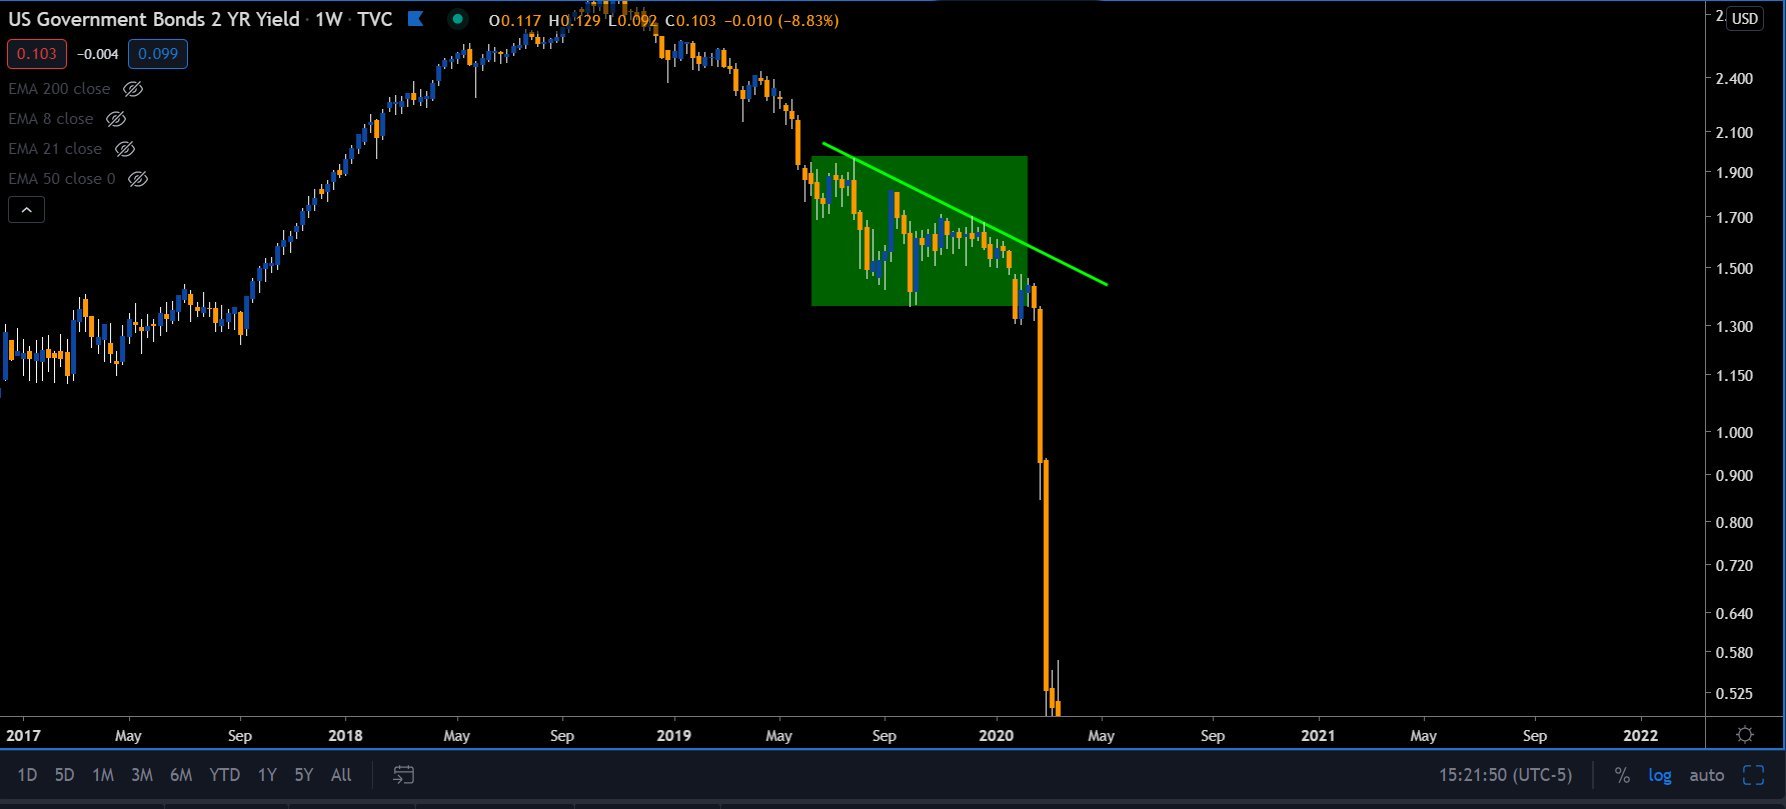
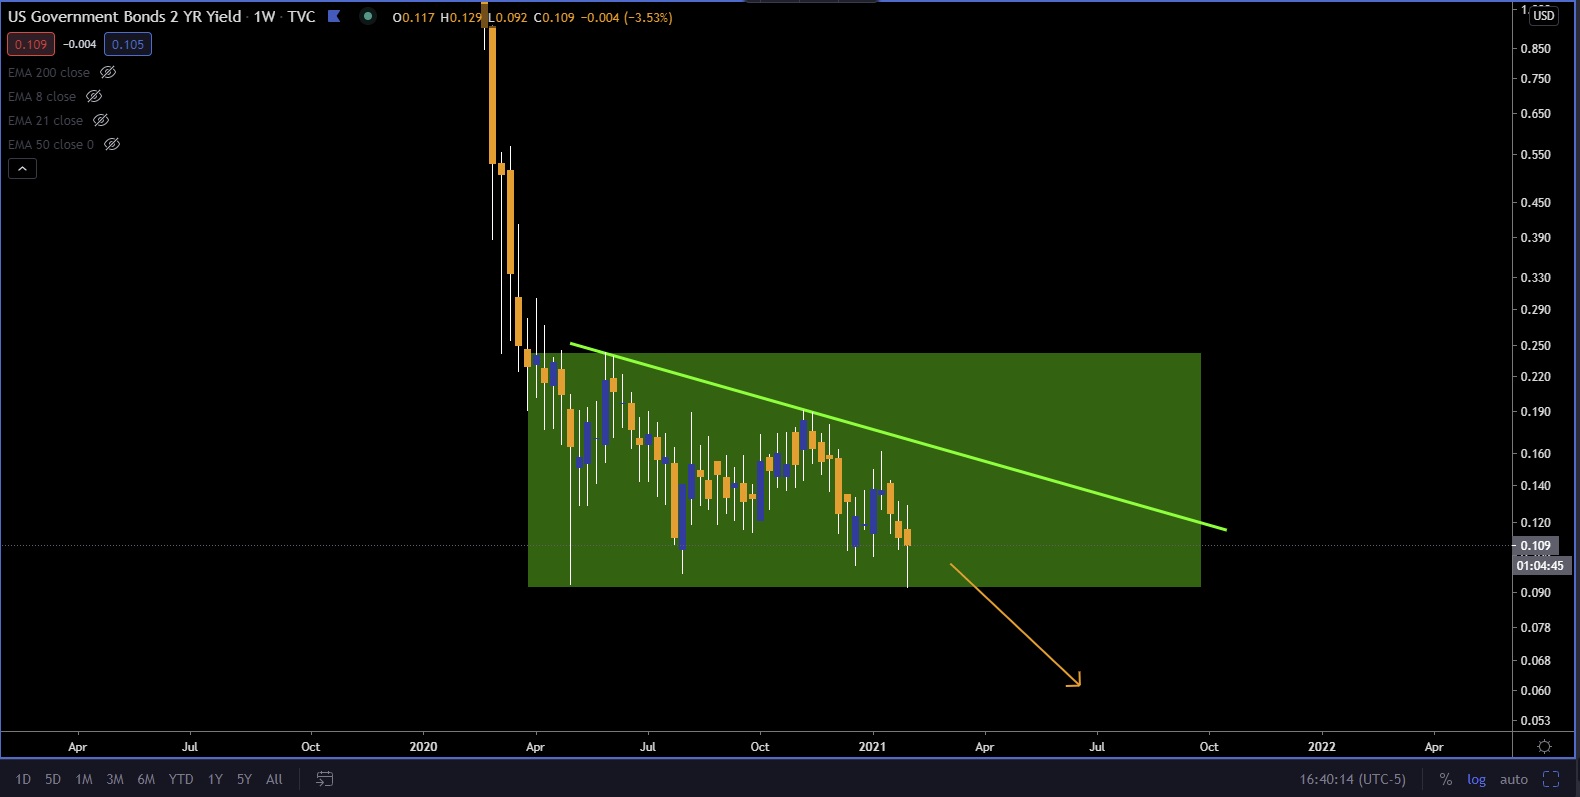
The first chart (below) shows the 2-year yield movement (green box) just prior to the March 2020 liquidity event. The 2-y yield broke below this area of consolidation just a couple of weeks before the rush to cash ensued. The 2nd chart (below) shows the 2-y yield’s current movement (green box) which looks very similar to its movement just prior to the last liquidity event. It is now threatening to break out to the downside.
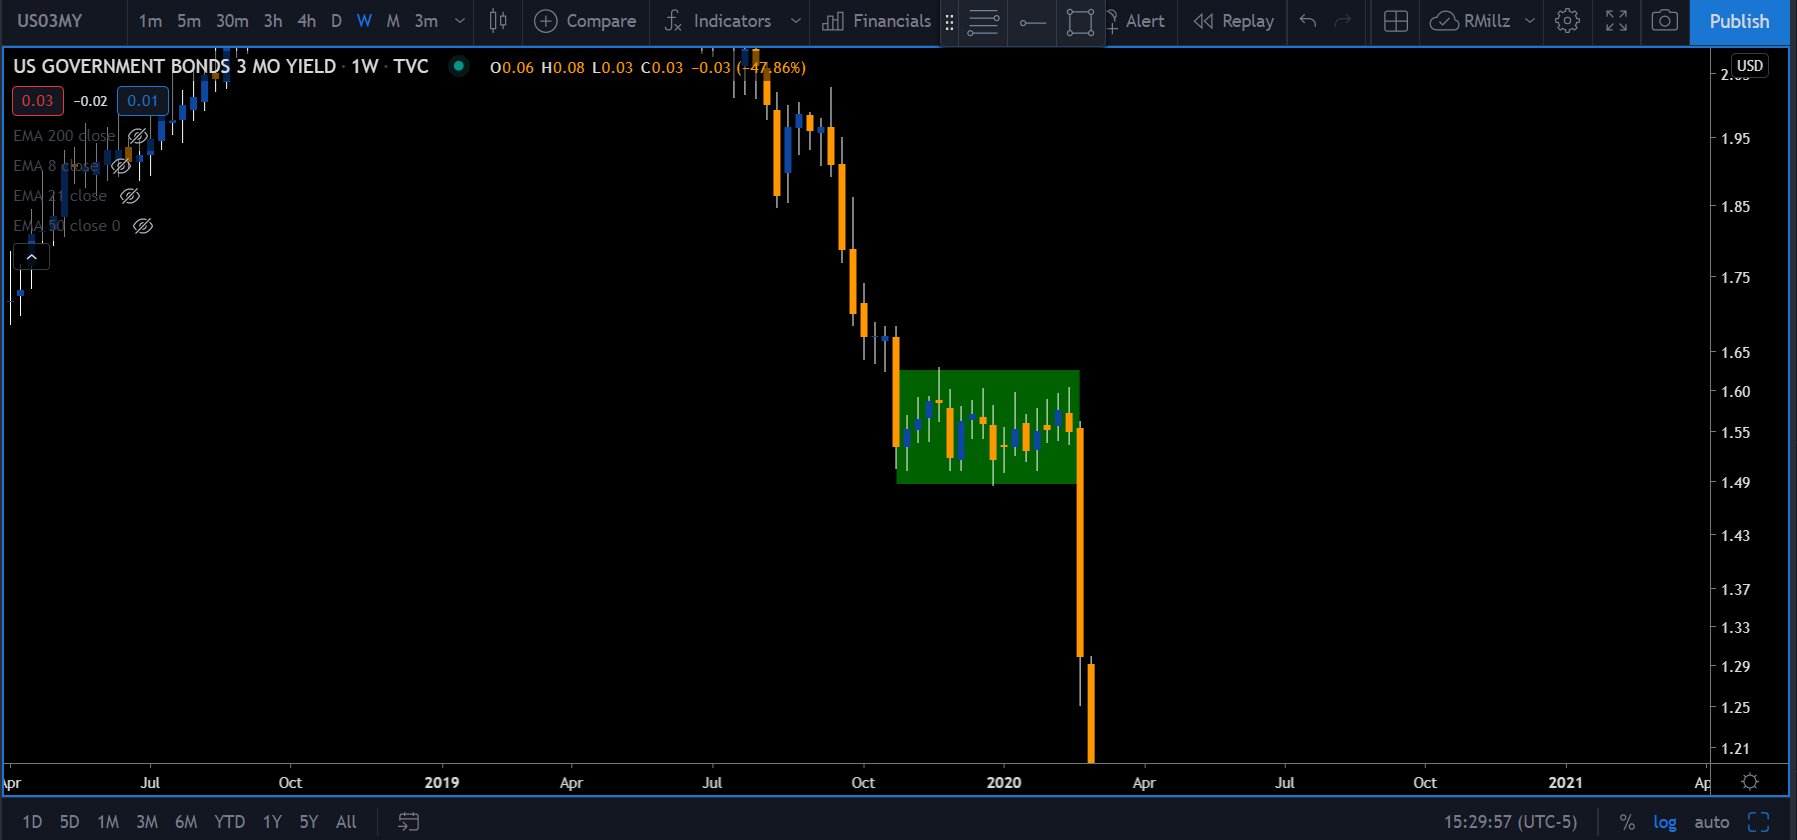
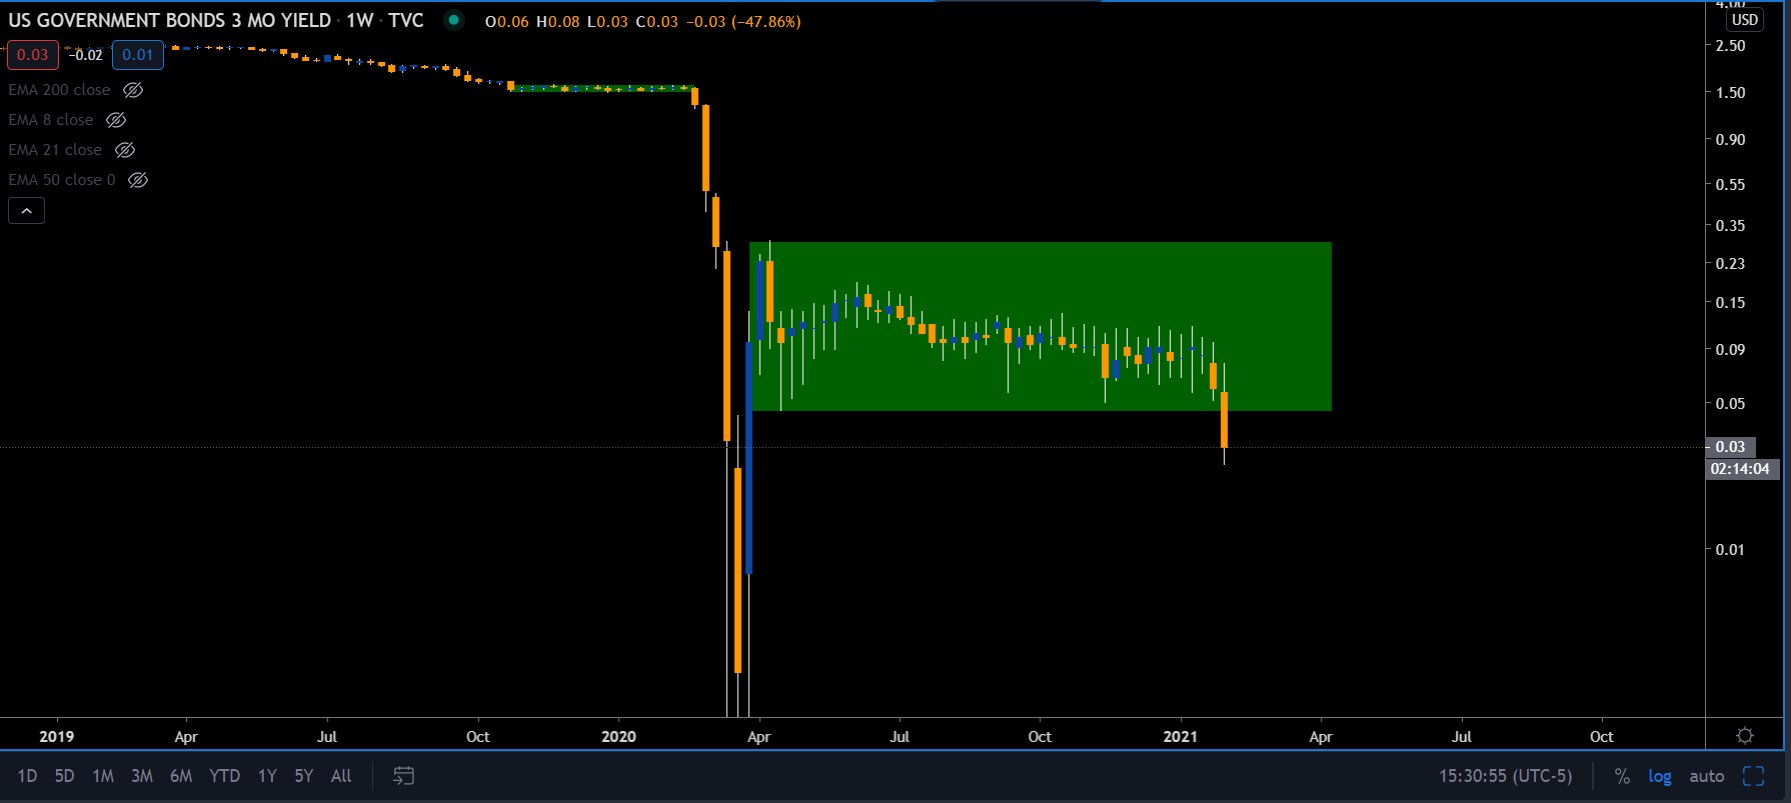
Now, let’s take a look at the yield on the 3-month T-bill. The first chart (below) shows the yield on the 3-month’s movement (green box) just prior to March 2020. The 2nd chart shows the 3-m yield’s current movement (green box) which looks eerily similar to how it did just prior to March 2020. Unlike the 2-y yield, the 3-month yield just closed outside of it consolidation, breaking further to the downside.
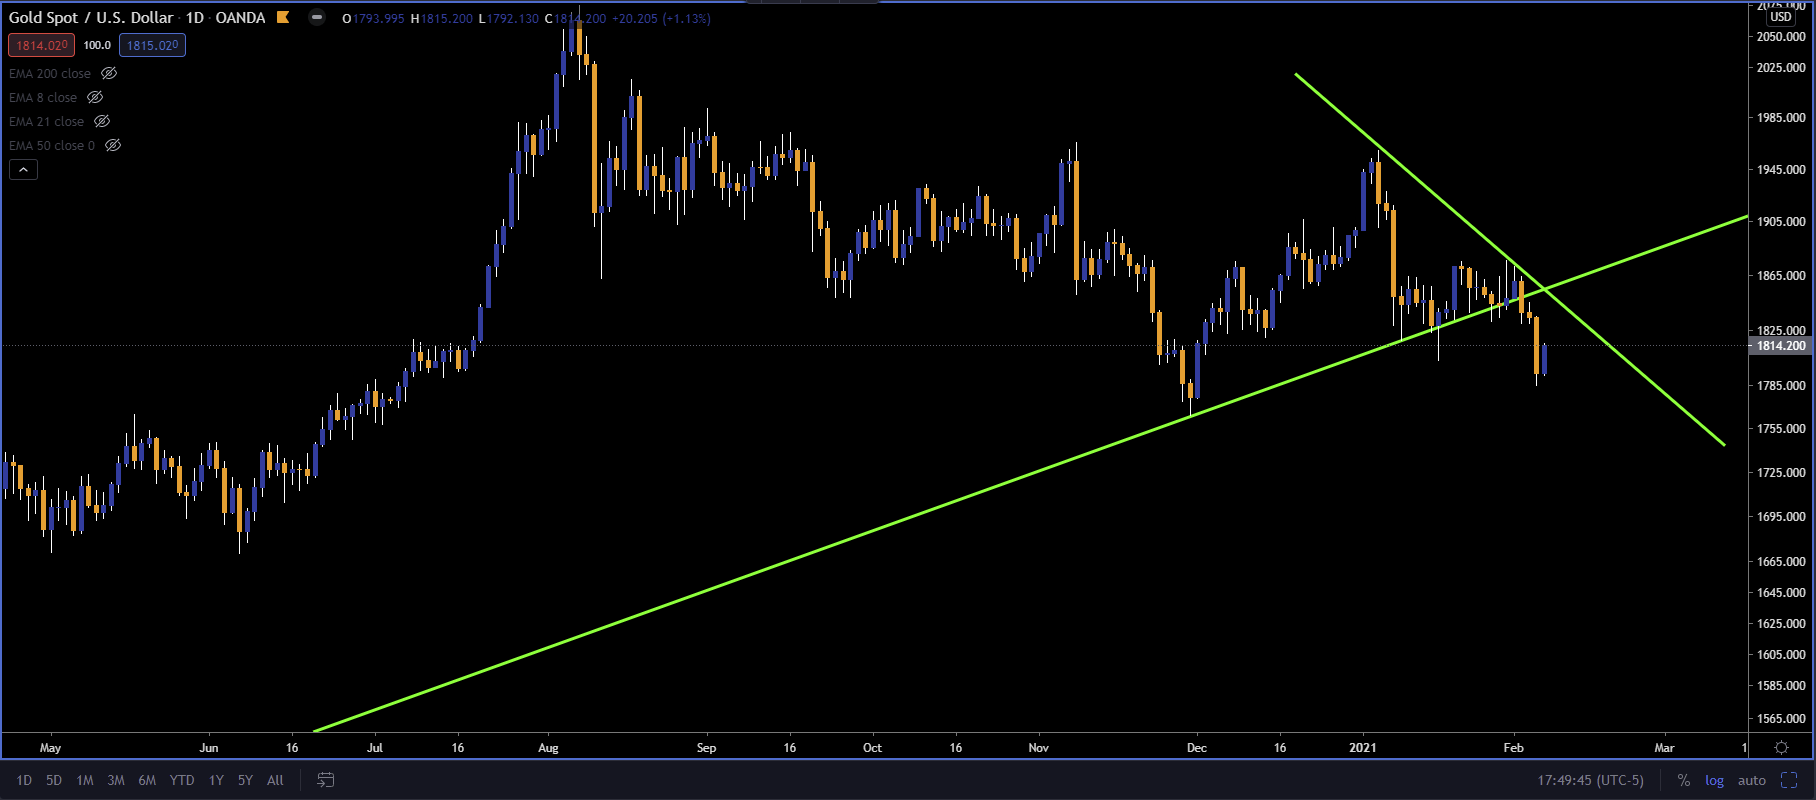
The downward pressure on the short-end of the yield curve gives us some insight into the liquidity (collateral) shortage issues that are brewing underneath the surface. When you combine this with the recent price movement in gold, it gives us a clearer picture of what’s happening. Gold, despite acting as a “safe haven” at times, gets sold during liquidity events. Investors do not want to sell gold but are forced to during a liquidity event in order to obtain the dollars they need to service debt or margin calls. If you look (below) you can see gold is starting to break lower, which coincides with the idea that liquidity pressures are building, because those that realize what is happening are trying to obtain liquidity (cash) by selling gold and/or buying T-bills before everyone rushes to do so.
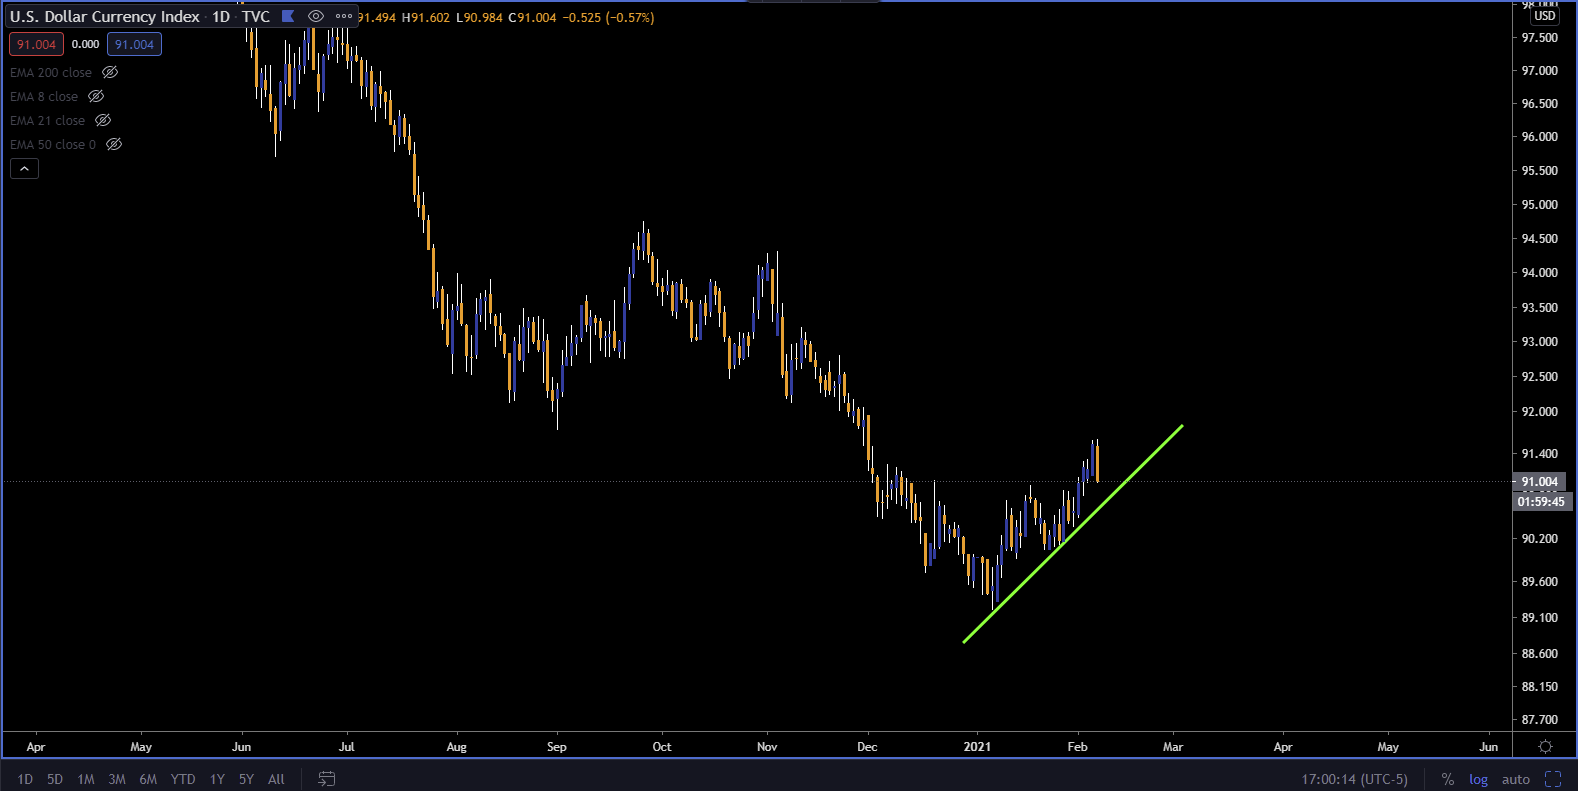
One last piece to the puzzle has been the US dollar’s (DXY) bottoming out/rise over the past month which you can see below. The US dollar rising confirms that investors are trying to get to cash. Remember, back in March 2020, when risk assets sold off, the DXY spiked about 10% in less than two weeks. Now, none of this means a liquidity event will happen Monday morning or even a couple of months from now, but things are starting to look awfully similar to the way they did just prior to the last such event we had in March 2020 and most are not ready or protected if it does happen. Again, I am not writing this for anyone to take action but to merely understand what is happening in the markets and what risks there are to consider. I will be paying particularly close attention to the short-end of the yield curve, gold, and the dollar going forward to try and determine if the pressures are going to continue to build or if they decide to start easing at all.
Author

Ryan Miller
Ryan Miller Trading Economics
Ryan Miller received a Bachelors Degree in History from William Paterson University. Through his studies of U.S. history, he developed an interest in the implications the financial markets have on the economy.


