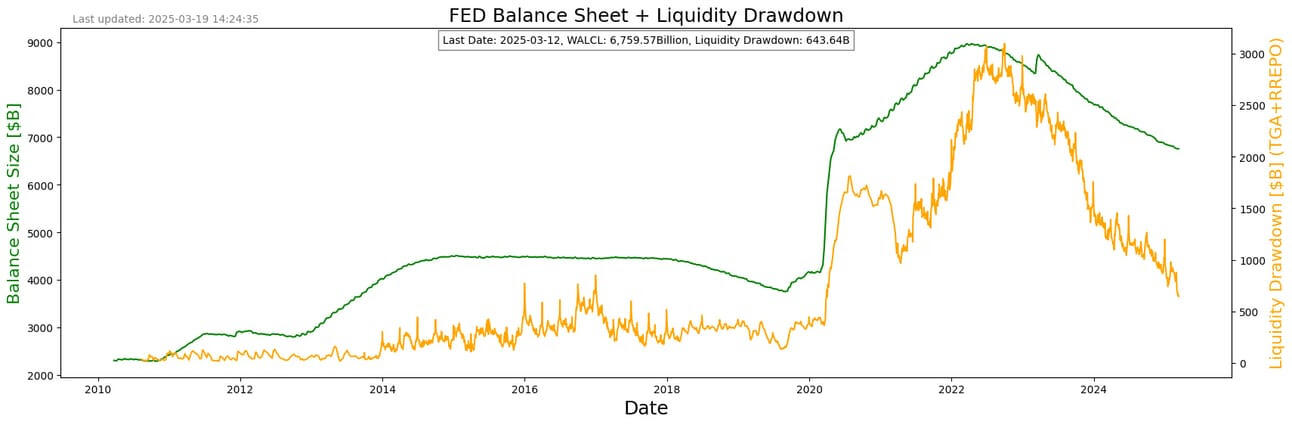
The Fed balance sheet is back to where it was before the Covid pandemic

S2N spotlight
I am not in the mood for anything heavy today. Unfortunately, this can be quite a heavy subject. Don’t stress; I am going to make it dead simple. If you want, you can skip to the conclusion, all will be good. [On a reread I am not sure if I made it as simple as I could have. I probably added too much in—sorry, I am too lazy and too late to edit it now.]
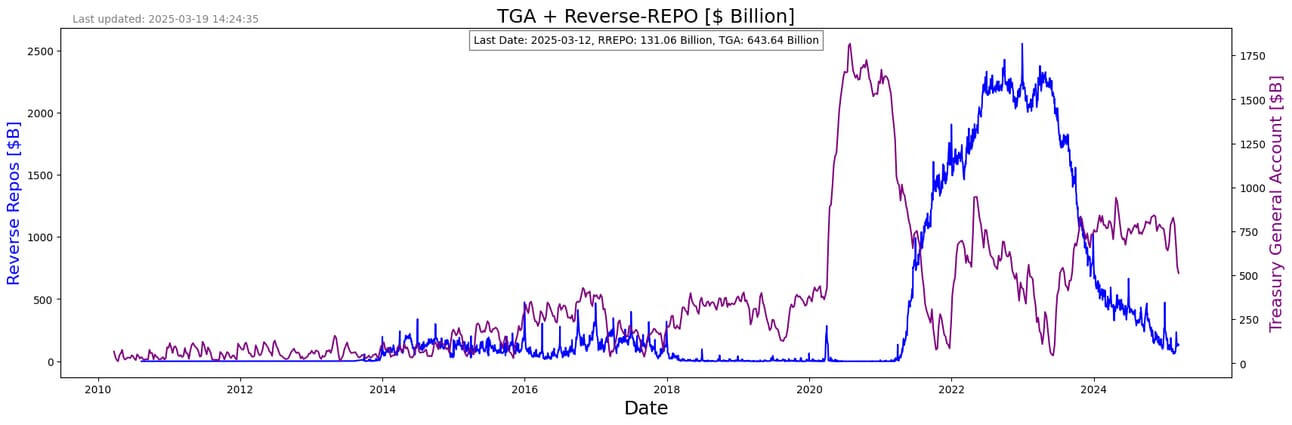
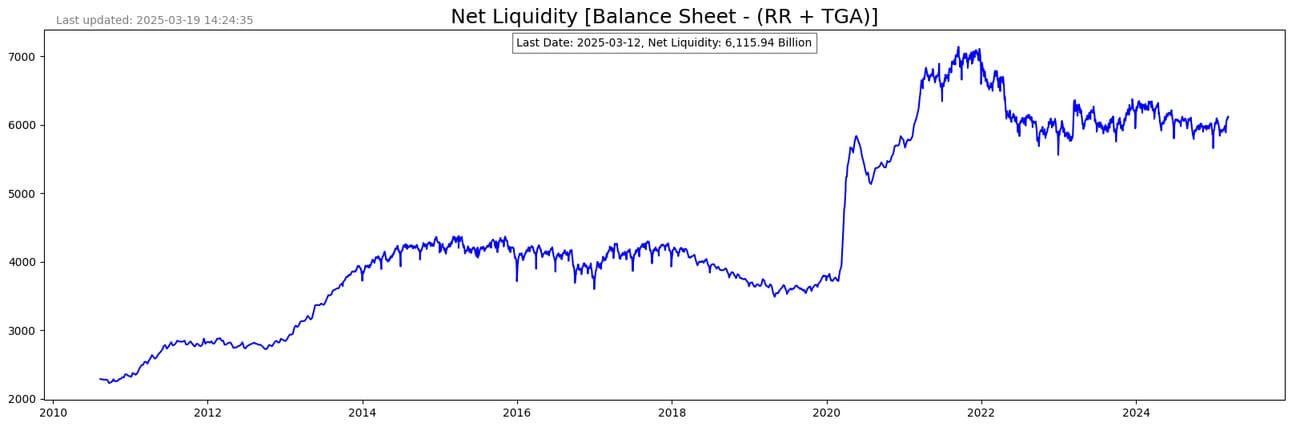
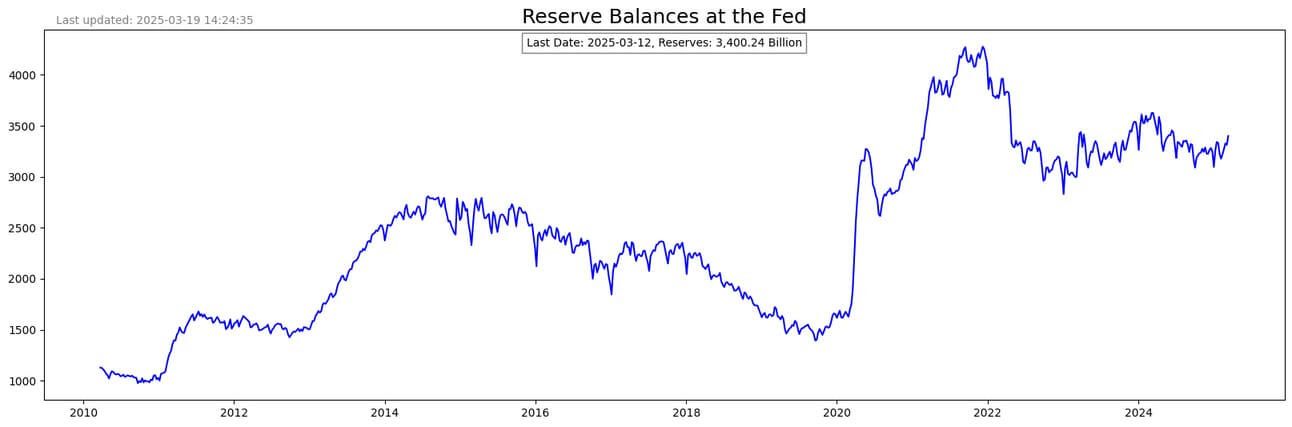
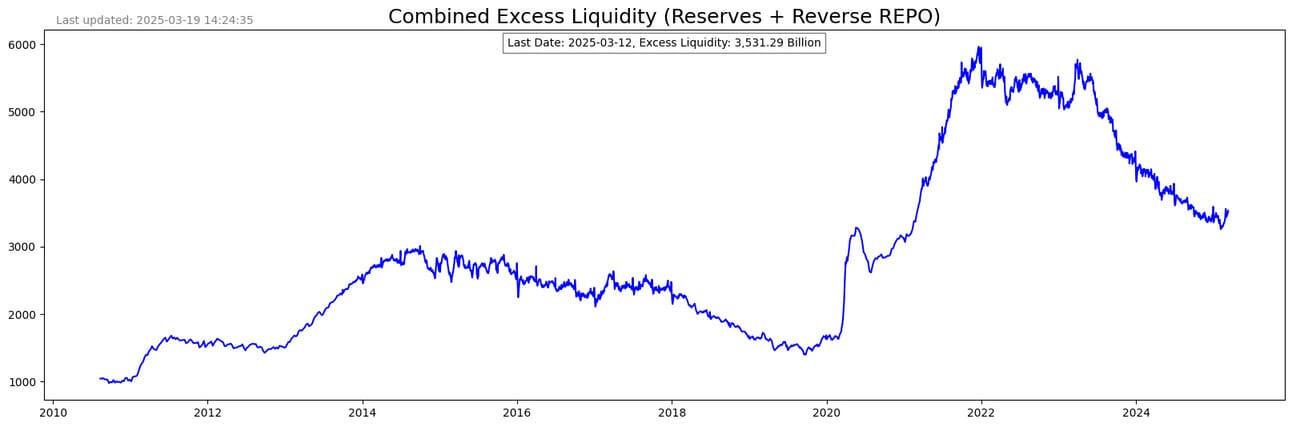
Let me first introduce the main actors in the money show. You have the Fed. You have the Treasury’s General Account. You have Reserves, which is the money deposited with the Fed by the big banks. Lastly, you have the Reverse Repo which is quite a complex system, but it essentially is a tool for the Fed to manage the short-term Fed Fund Target rate and control excess liquidity in the money markets.
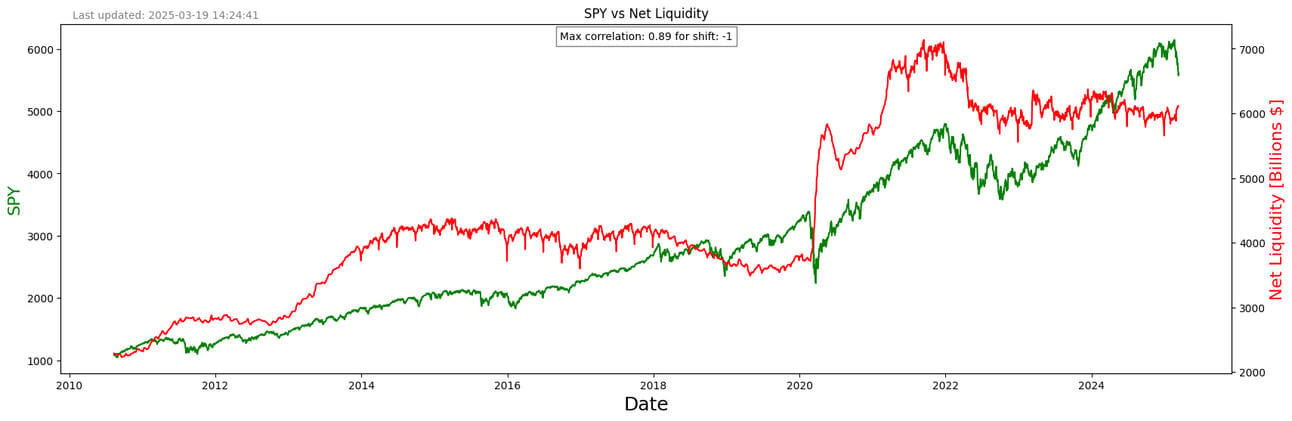
I have tried to make the chart titles self-explanatory.

Concluding thoughts:
The Fed balance sheet is back to where it was before the Covid pandemic. It is sitting at $6.7 trillion. The Reverse Repo balances have almost come back to zero from nearly $3 trillion. Treasury’s TGA account has recently drawn down quite a lot and is now sitting at close to $500 billion. This is stimulatory to the markets as drawing down on TGA increases Reserves, which means banks have more money to lend.
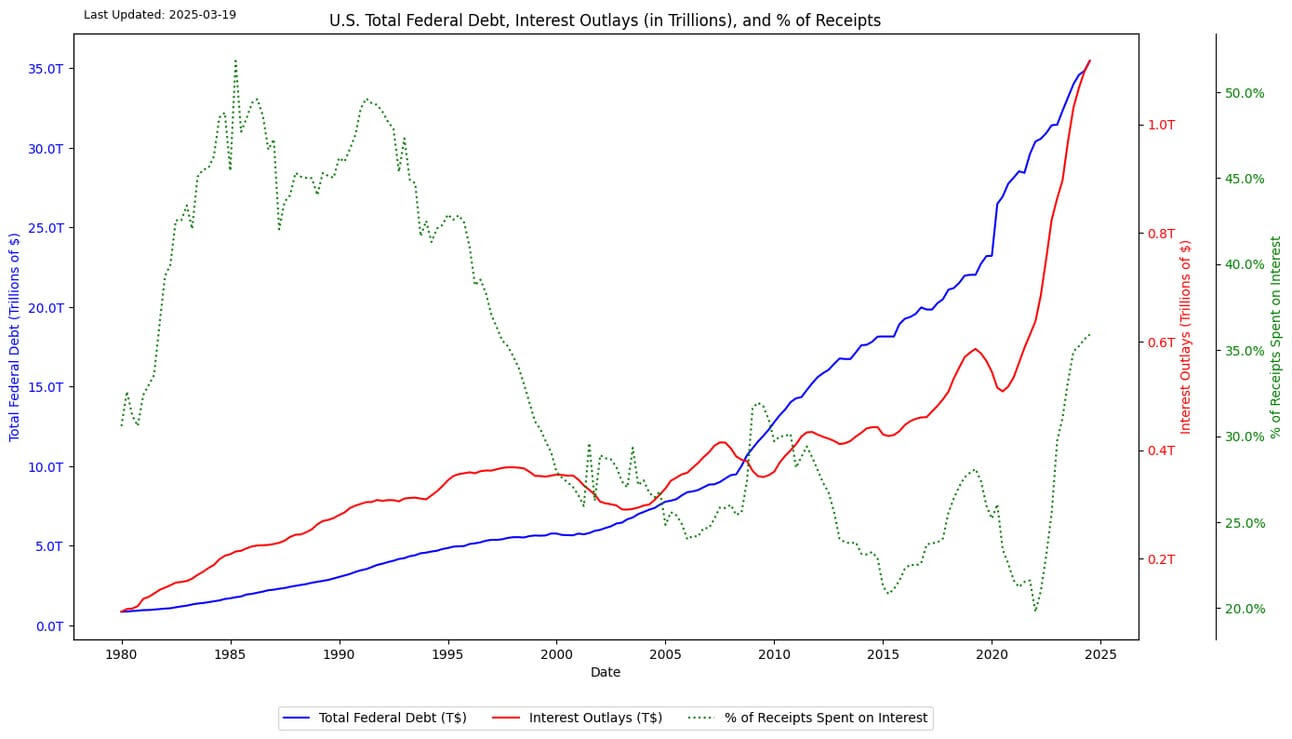
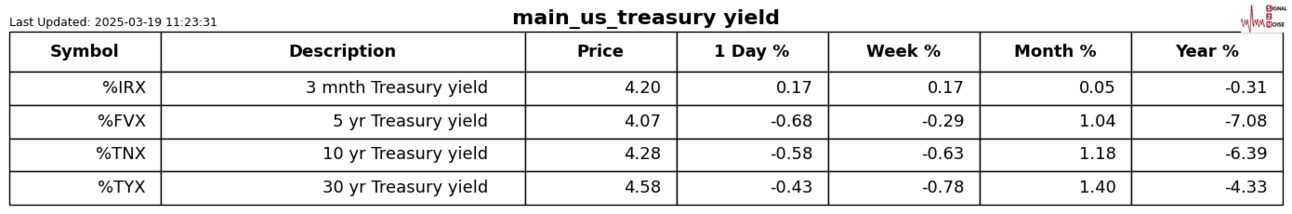
Against the above backdrop we have a situation where outstanding Federal debt is higher than the $35 trillion I am showing. Also, interest on this debt is at $1.2 trillion.
Quantitative Tightening (QT) has ended. Over the next 4 years, $28 trillion of the $36 trillion will need to be refinanced along with, I am sure, even more new debt. Who is going to buy all the debt? If the Fed restarts its QE program, it will be injecting liquidity into the market, which will be inflationary. It alone cannot do all the heavy lifting. The only way this mountain of debt is financed is through a combination of higher interest rates and inflation.
S2N observations

I do a fair share of dumping on Elon Musk. However, today I take my hat off to the man for bringing these 2 astronauts down to earth. Pretty amazing stuff. This guy gets difficult things done and has a heart. Even if it is good press and he knows it. Well done and thank you.
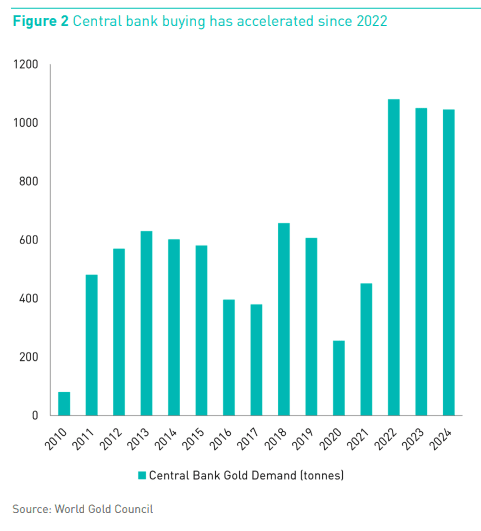
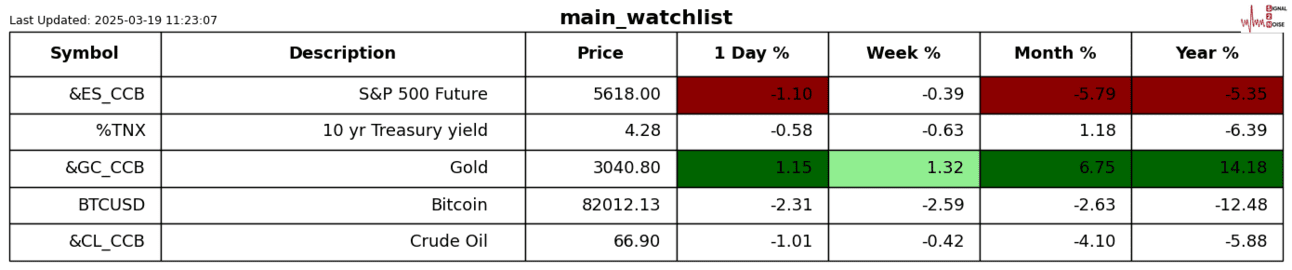
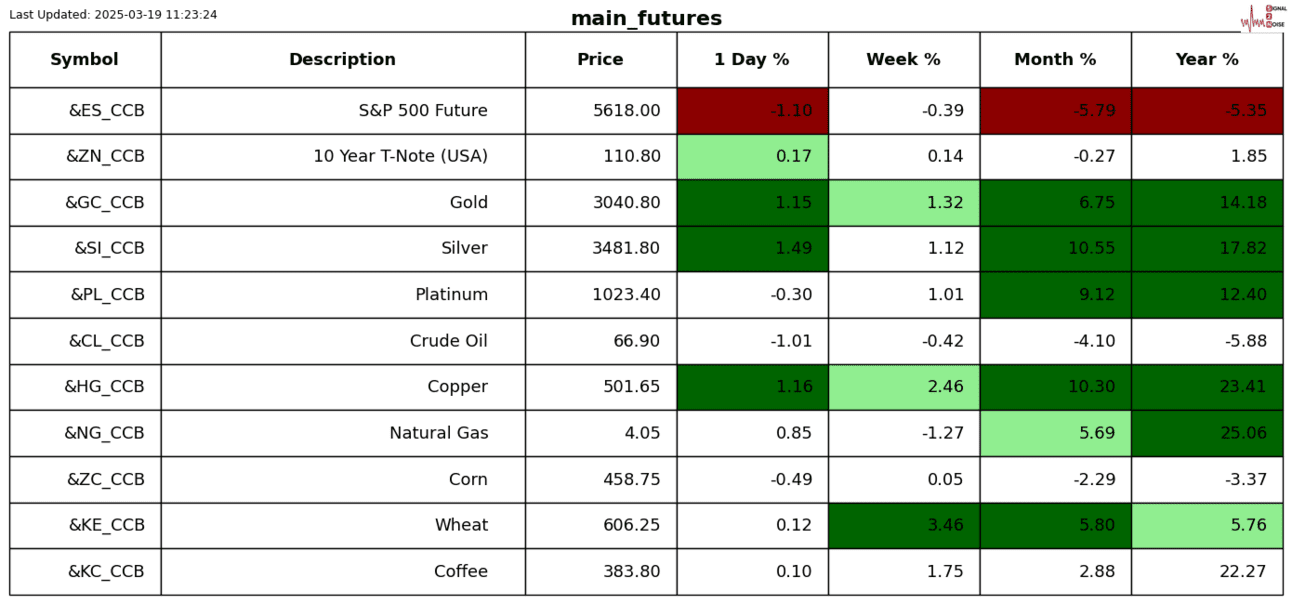
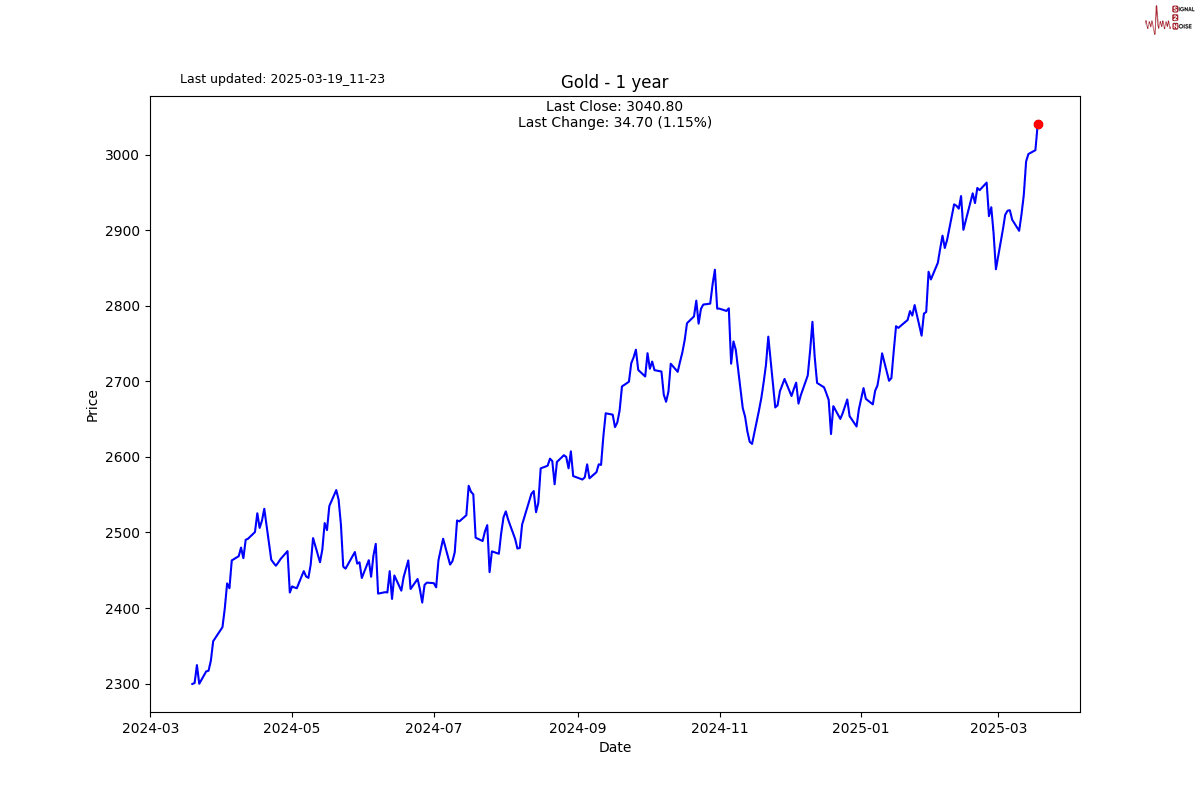
Against the backdrop of the bleak picture I painted above, you can see why world central banks have been buying serious amounts of gold since all the money printing took off.
You can expect the gold buying to continue as we navigate through all this debt.
S2N screener alert
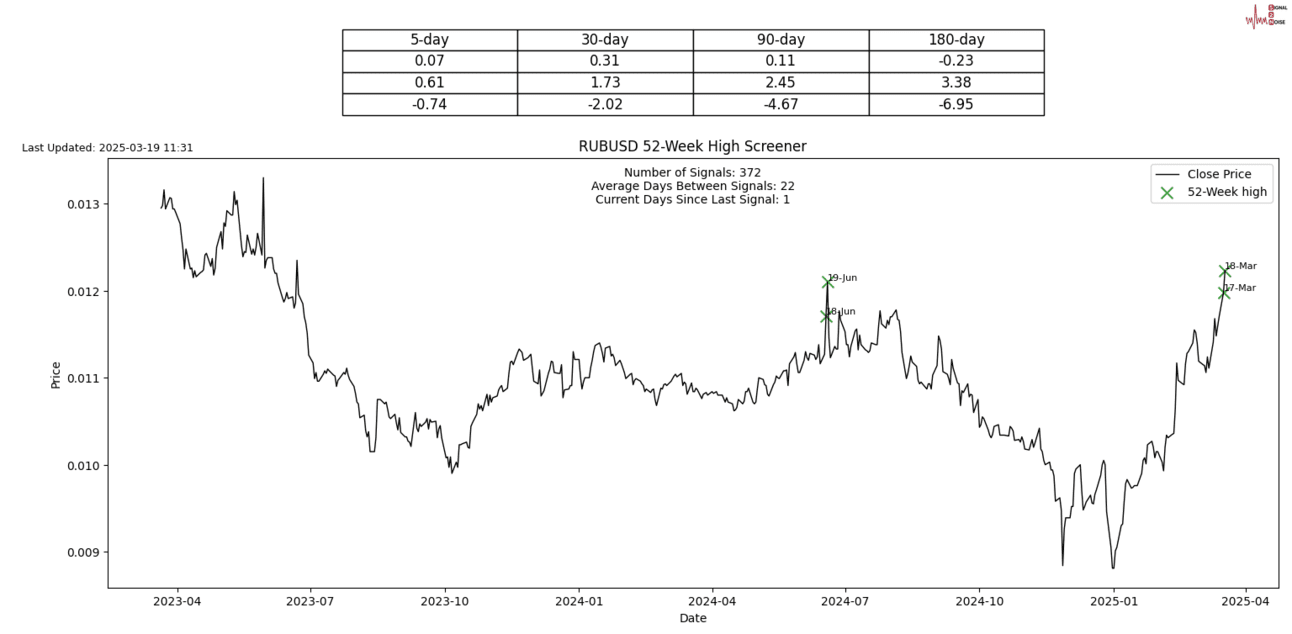
The Russian Rouble had its chance after the stock market to make a new 52-week high. WTF.
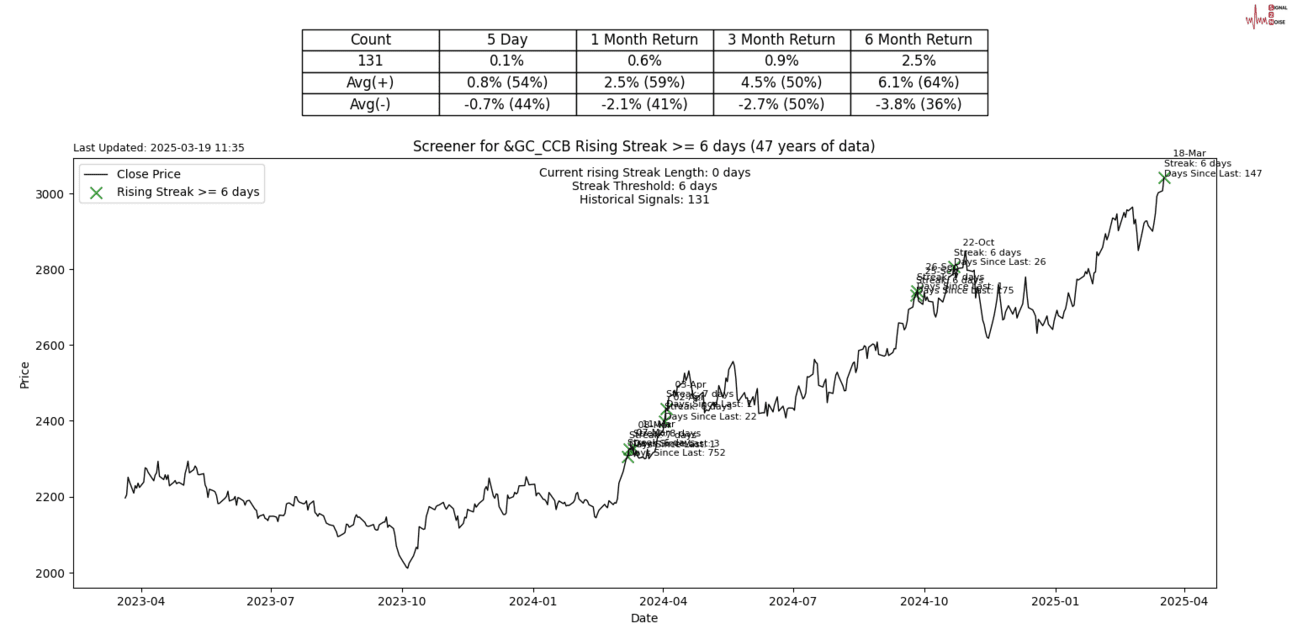
Gold Futures were up 6 days in a row.
S2N performance review
S2N chart gallery
S2N news today
Author

Michael Berman, PhD
Signal2Noise (S2N) News
Michael has decades of experience as a professional trader, hedge fund manager and incubator of emerging traders.