Laboring under an illusion?

Every month we stress how important the monthly US non-farm payrolls are, and every month it’s true. Nonetheless, may I make a special plea for this month? Several members of the Federal Open Market Committee (FOMC), the US Fed’s rate-setting body, specifically said that they want to see the September labor figures before deciding what to do about their $120bn-a-month bond purchases. Now they will.
Why September? Two reasons. One, some people were no doubt staying out of the labor force because they had to take care of their children. With school starting up in person in September in many places, those people can now go back to work. Secondly, the federal government’s exceptional unemployment benefits expired on Sept. 6th. Some people imagine that these folks preferred to sit home watching Netflix and collecting unemployment and now that their checks have stopped arriving, they’ll be forced to get off their duffs and look for work (although research into those states that ended their unemployment benefits early showed no such tendency, but Republicans are happy to grasp any excuse to withdraw benefits from people).
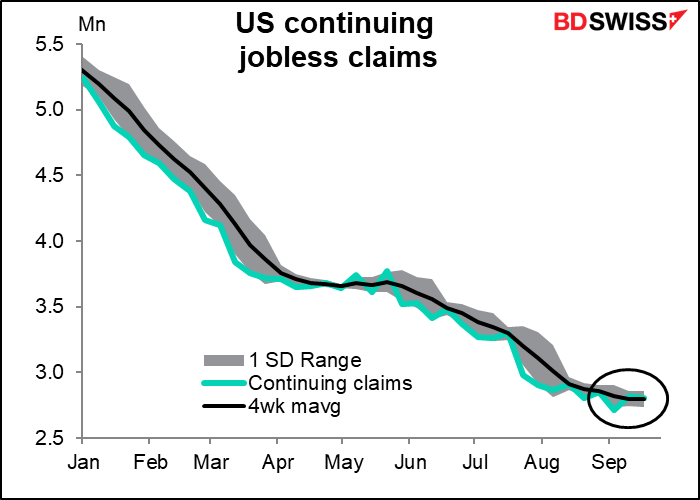
Unfortunately, the evidence from the weekly jobless claims figures isn’t that good. Continuing claims are falling, but only gradually. There has been no sign of the Netflix-watchers getting off their couches en masse and taking minimum-wage jobs with uncertain schedules and no benefits.
Meanwhile, initial jobless claims have been rising – three consecutive weeks of rises. They’re back to where they were in early August.
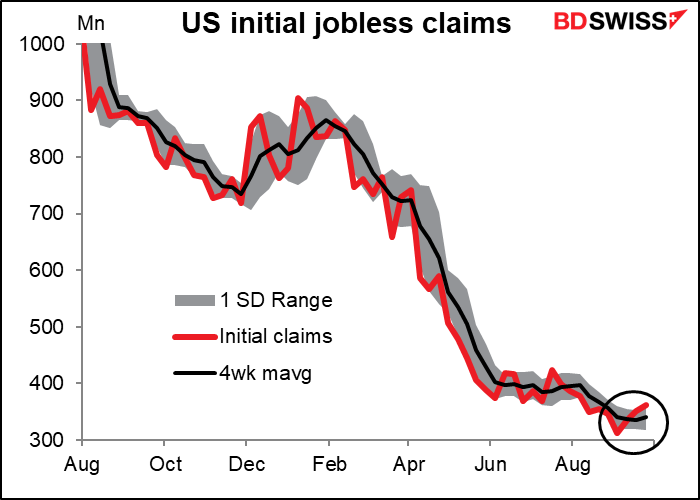
However…things might not be all they seem. Apparently one of the main reasons why jobless claims have been soaring is because of a technicality: California has been transferring “hundreds of thousands” of unemployed people from one federal program to another. That added over 17k to the unadjusted initial jobless claims a week for the last two weeks. There’s also some distortion caused by Hurricane Ida, which can’t be blamed on the economy.
There are other indications that the unemployment situation isn’t so bad. The Conference Board jobs diffusion index – the % of respondents who say jobs are “plentiful” – the % that say jobs are “hard to get” – continues at a very low level despite the recent plunge in consumer confidence. (Although it did fall slightly in the latest month – is that turning point the first sign of a change in the trend?).
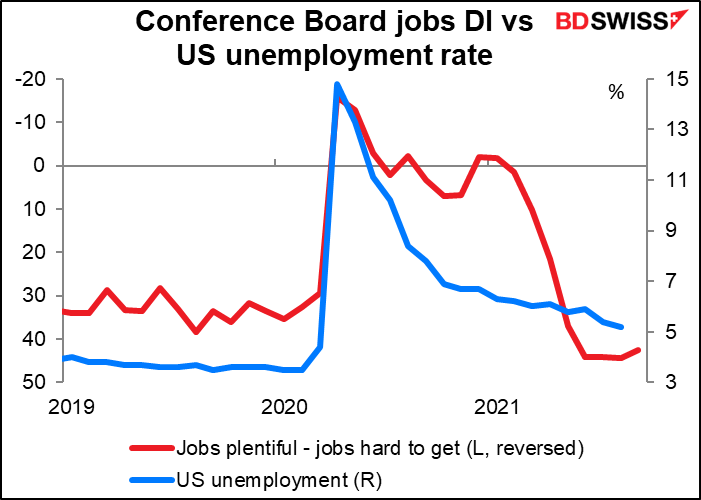
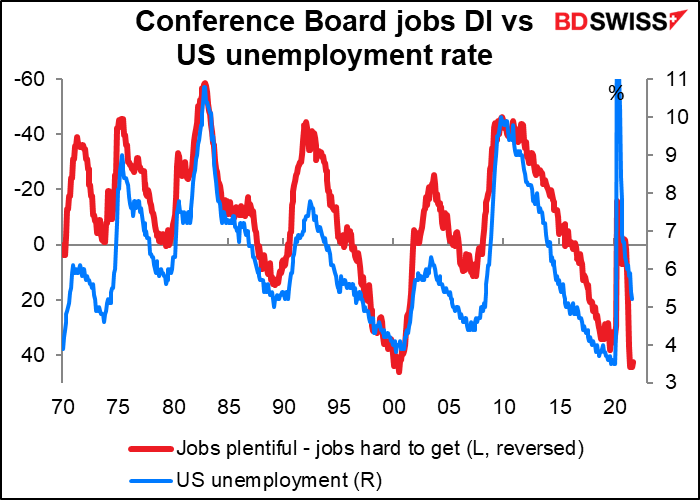
The difference between the two has been a good indicator of the employment situation over the longer term.
And the Institute of Supply Management’s non-manufacturing employment purchasing managers’ index (PMI) remains above the 50 line signaling continued hiring.
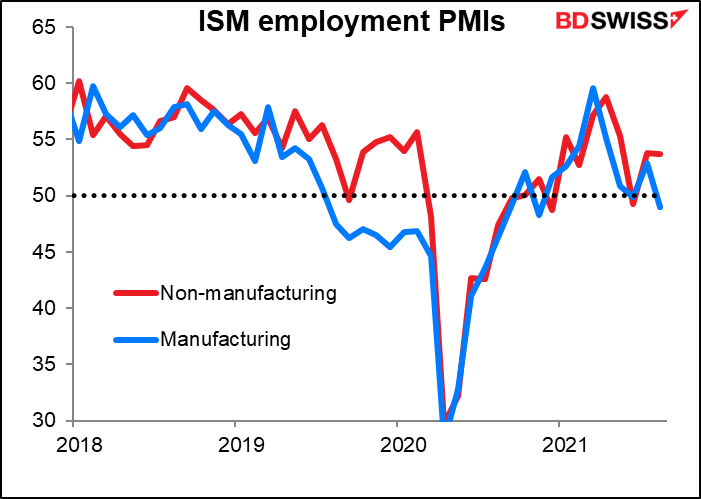
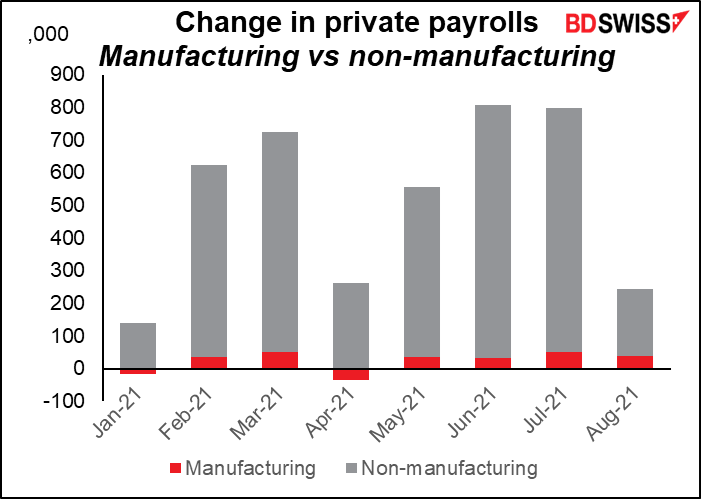
Although the manufacturing PMI is below 50, that isn’t so significant, because non-manufacturing is overwhelmingly where the new jobs come from.
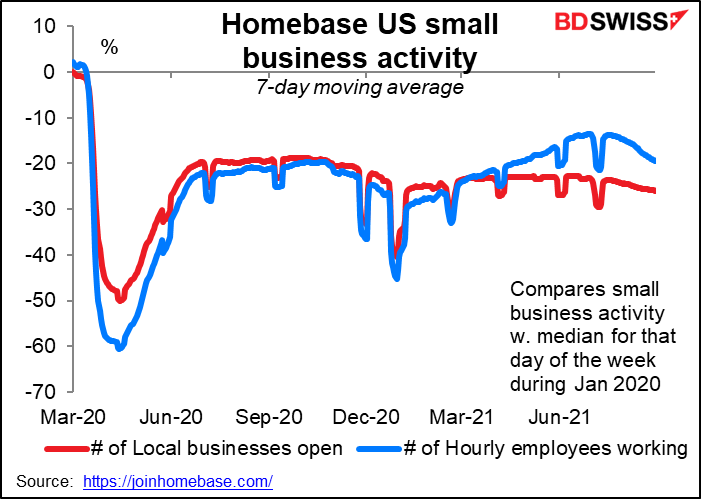
On the other hand…(there’s always another hand in economics…) According to Market News International, the St. Louis Fed’s employment model based on the Homebase data for the activity of small US businesses implies a loss of 818k jobs. Unfortunately I can neither access the full MNI article nor do I have the Homebase data for September as it’s delayed one month for non-subscribers. The number of people working was declining in August (blue line) though.
The market is looking for a moderate rise in payrolls of 500k. That would certainly be better than last month’s pitiful 235k, but it’s not in the 900k – 1mn range that people want to see.
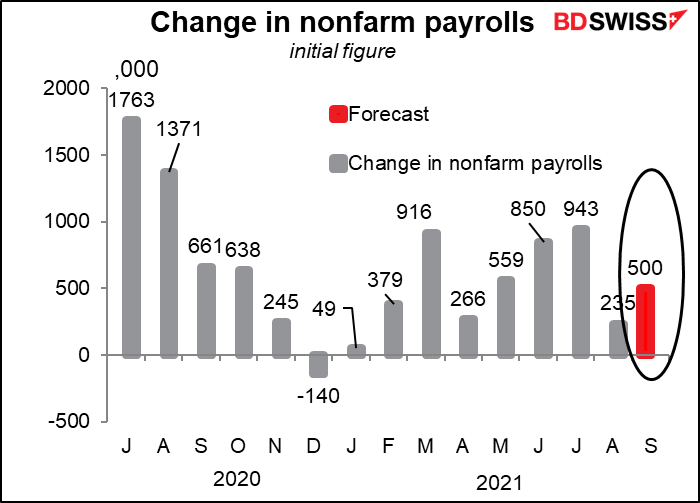
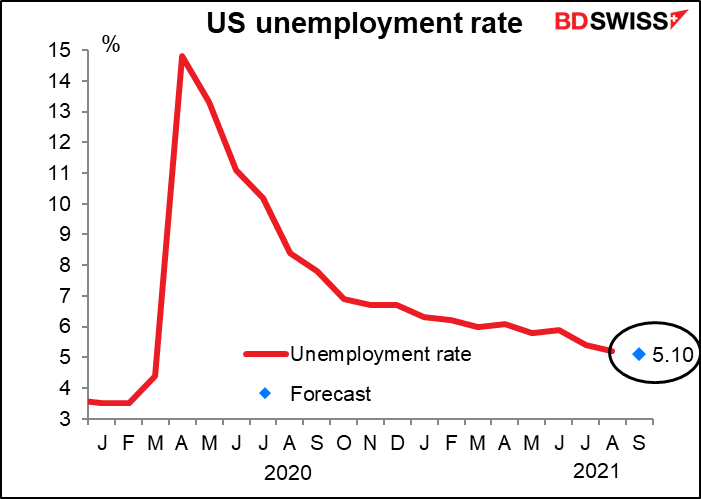
Meanwhile, the unemployment rate is expected to tick down one tick to 5.10%.
The FOMC won’t have the October employment data when they next meet on Nov. 3rd, so this is it. Will this constitute “substantial further progress?” on the labor front? Enquiring minds want to know!*
(*for those non-US readers, this was an advertising slogan used in the '80s by the National Enquirer, a supermarket tabloid.).
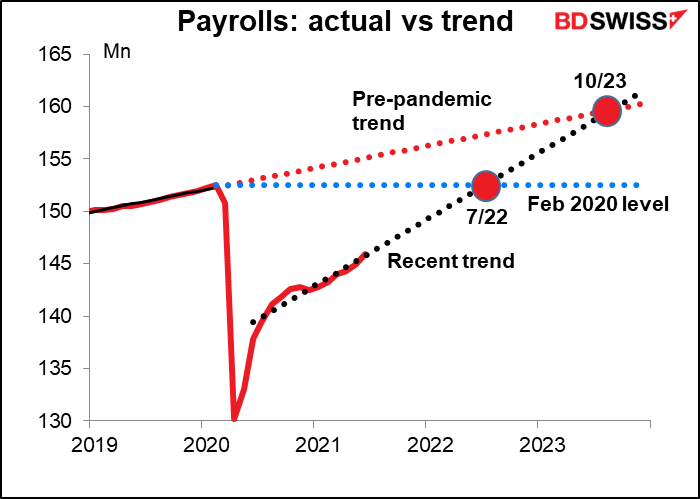
The US is still 5.2mn jobs short of where it was before the pandemic, and 8.6mn short of where it would’ve been if payrolls had continued to grow at the pre-pandemic trend (admittedly, the unemployment rate was 3.5% then so it might’ve been difficult for jobs to continue increasing at that pace.).
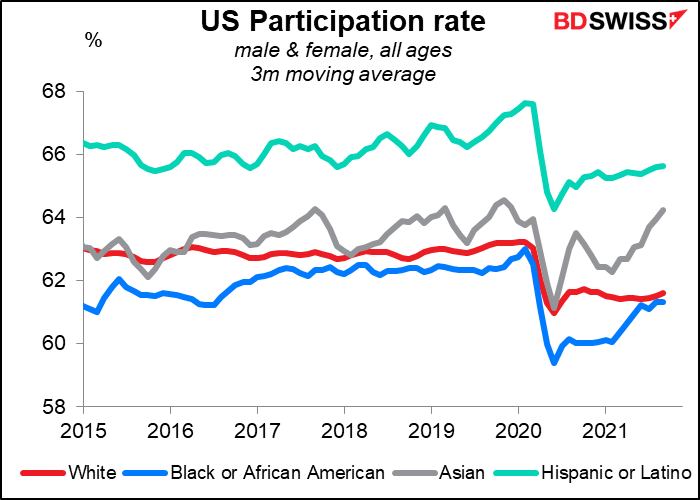
Participation rates for most ethnic groups are still well below their pre-pandemic levels, except for Asians.
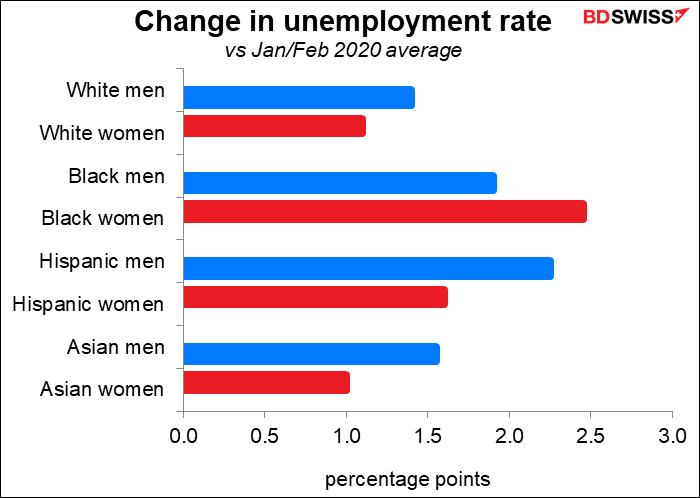
And the unemployment rate has risen more for minority men and women than for White men and women, with the exception again of Asians. There’s still some way to go before the Fed reaches their goal of “broad and inclusive” improvement in the labor market.
Nonetheless, I think they are determined to begin tapering down their $120bn-a-month bond purchases unless something dramatic happens. At this point the bar to no action is much higher than the bar to action, in my humble opinion.
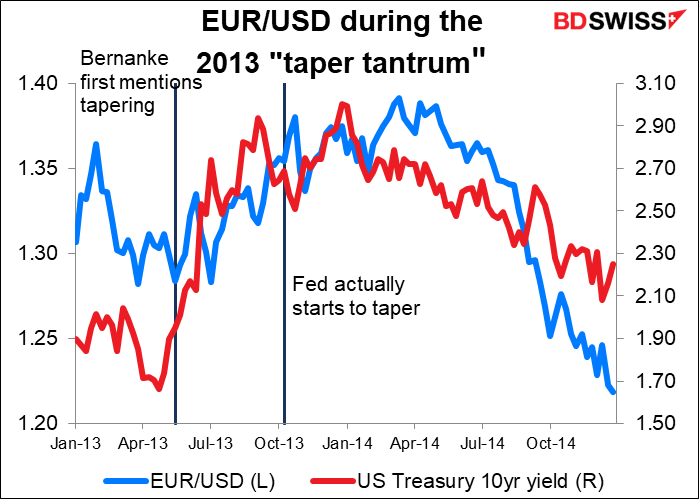
I should mention by the way that tapering down the bond purchases can go along with both lower bond yields and a stronger dollar. At least that was what happened back in 2013, when we had the famous “taper tantrum” of sharply higher yields after then-Fed Chair Bernanke started talking about tapering. Yields surged ahead of the event, but once it actually started, yields quickly topped out and started coming down again. EUR/USD oddly enough followed US yields – rising as Treasury yields rose and falling as Treasury yields fell, which is counterintuitive.
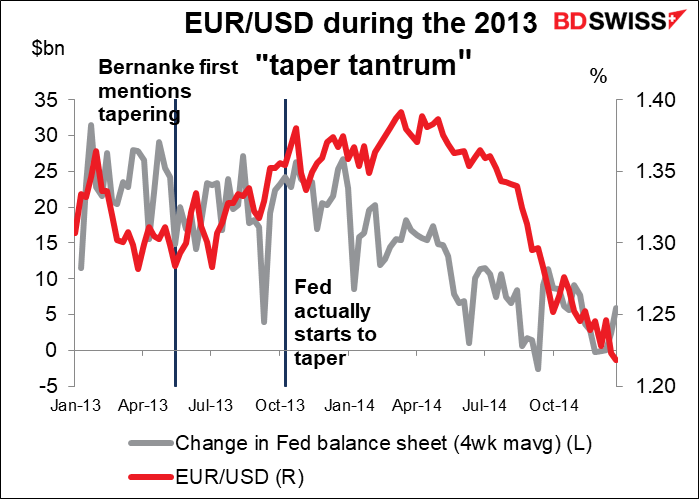
Presumably it’s because the Fed’s balance sheet was growing more slowly and then contracting, in which case we could see the dollar strengthen further once it begins this time too.
Central bank meetings: RBA, RBNZ
It’s antipodean week for central bank meetings. The Reserve Bank of Australia (RBA) and the Reserve Bank of New Zealand (RBNZ) meet this week, the former on Tuesday and the latter on Wednesday.
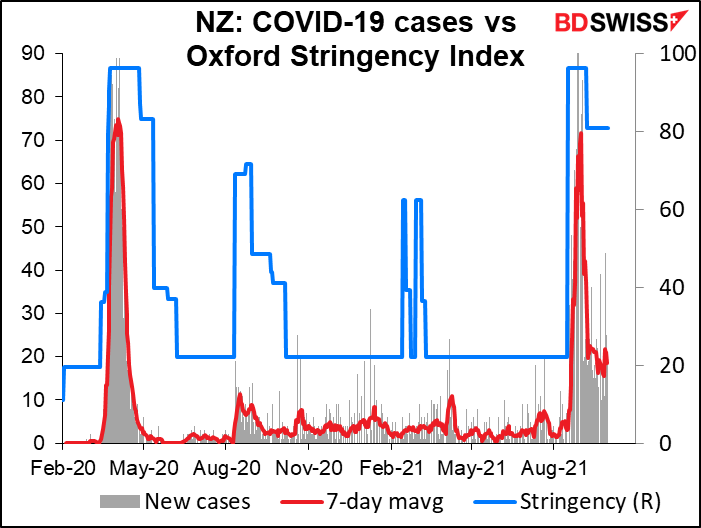
The RBNZ was planning on hiking rates at its Aug. 18th meeting, but that plan was derailed when the entire country was put on “Level 4” lockdown less than 24 hours before the meeting. The statement following the meeting said, “The Committee agreed that their least regrets policy stance is to further reduce the level of monetary stimulus so as to anchor inflation expectations and continue to contribute to maximum sustainable employment. They agreed, however, to keep the OCR unchanged at this meeting given the heightened uncertainty with the country in a lockdown.”
Since then they’ve been able to contain the outbreak and restrictions have been eased (but not lifted entirely).
So are they going to lift rates at this meeting? I think so and the market thinks so. The market is pricing in an 83% chance of a hike next week.
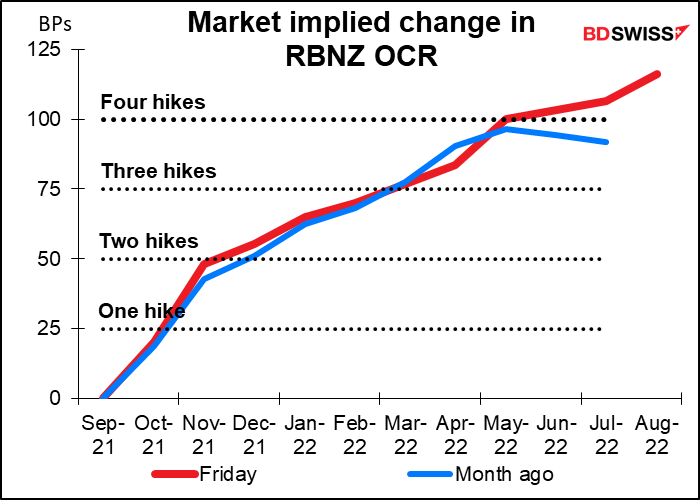
The case for hiking rates now is no different than it was back in August. Inflation is over the target zone, house prices are still rising, and the unemployment rate is back to where it was before the pandemic, which the RBNZ considers to be “at or above its maximum sustainable level.” With the virus now contained, I think they will go ahead with a modest 25 bps rate hike. I think this is probably the market consensus and so shouldn’t have that much impact on NZD, although it could boost it a little.
RBA: On hold
By contrast, the RBA is likely to remain on hold at its meeting Tuesday. The contrast with New Zealand couldn’t be clearer: Australia is now suffering an unprecedented number of new cases of the virus and continues to operate under a relatively strict lockdown. As a result, I would expect them to maintain their relatively dovish stance (if you remember, last month they extended their AUD 4bn a week bond purchases for three months “until at least mid-February 2022.”
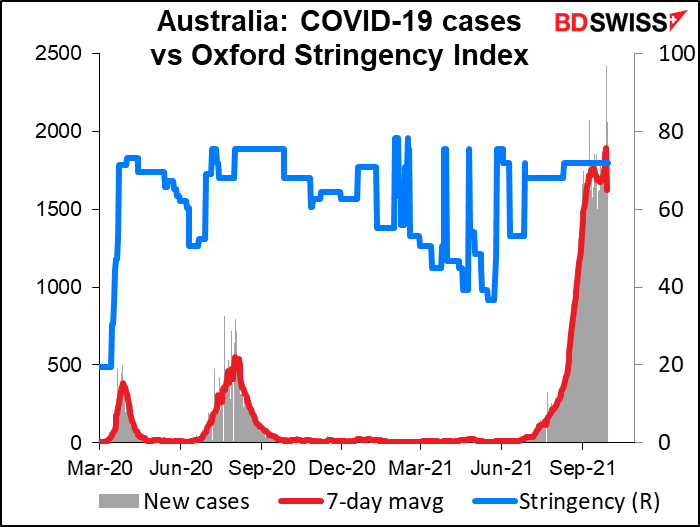
The RBA's assessment of the economy probably won’t have changed much in a month, especially as the two largest Australian states, New South Wales and Victoria, which together account for some 58% of the country’s population, remain under lockdown. But with progress on the vaccine rollout going better than expected, the RBA should feel comfortable repeating its assessment in the minutes of the last meeting that the outbreak has “delayed, but not derailed” the recovery. That suggests no further action to support the economy is likely to be forthcoming. I expect them to keep policy steady, which may cause AUD to decline somewhat on the “monetary policy divergence” theme.
In addition, the RBA's semi-annual Financial Stability Review will be released on Friday. Many officials have expressed concern recently about highly indebted mortgage borrowers. The FSR may make the case for some macroprudential measures to curb mortgage lending. That could also be a negative for AUD if it reduces the need to tighten interest rates to cool the housing market.
Other indicators: Not that much
Aside from that, there’s not that much of interest on the schedule this week.
OPEC+ meets on Monday, but it’s likely that once again they’ll just agree to stick to their agreement to raise output by 400,000 barrels a day and leave it at that. It shouldn’t have that much impact on the market as it’s no news to anyone who trades oil.
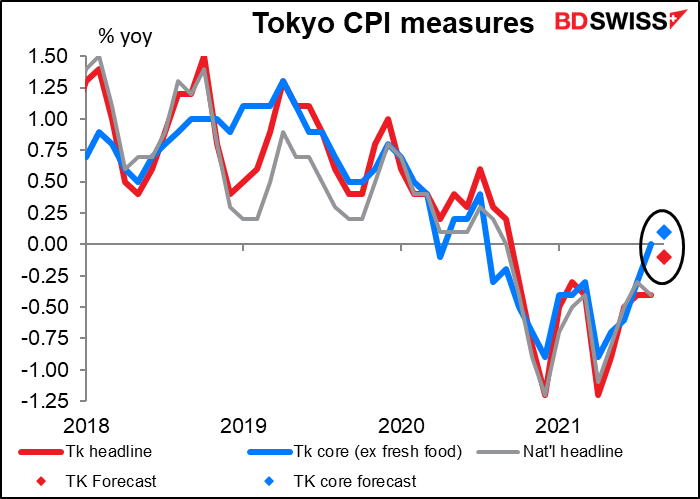
The Tokyo consumer price index (CPI) comes out on Tuesday. In theory this should be a big item – the market pays more attention to this than to the national CPI, as the Tokyo data comes out about two weeks earlier – but everyone knows that the Bank of Japan is on hold until Godzilla returns, and anyway bond yields can only move ±25 bps around zero, so what difference does it make? Especially since expectations are that inflation should remain around zero: the headline figure is forecast to be -0.10% yoy and the Japan-style core CPI is forecast to be +0.10% yoy.
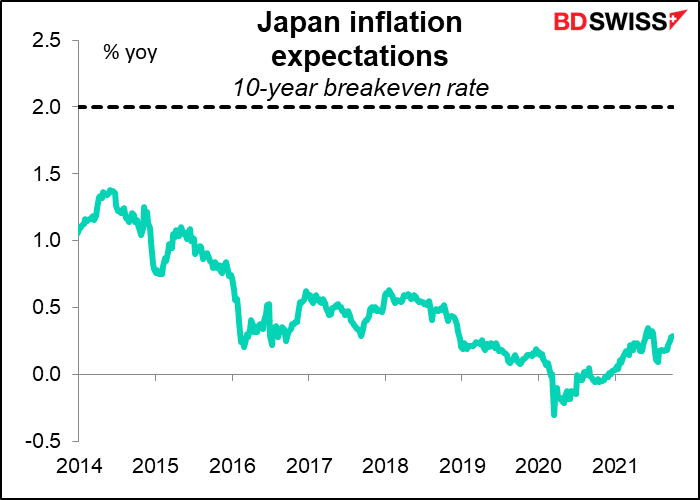
Snore. Wake me up when it gets around 1%, then we might start to have some excitement. However, looking at the breakeven inflation rate, that’s not likely to be for a long time, if ever.
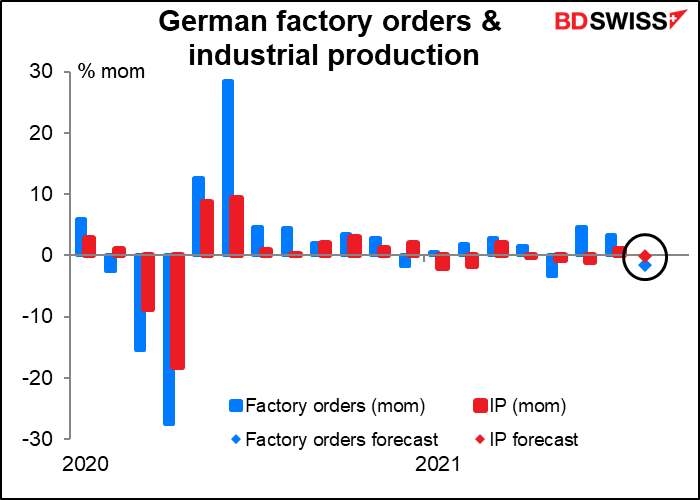
Other indicators: Not that much come out Wednesday and industrial production on Thursday. Both are expected to falter: orders are forecast to be down 1.5% mom and IP down 0.1% mom. This may suggest a cooling of the European economy that would be negative for EUR.
Author

Marshall Gittler
Trading Analysis


