Key trading levels for the week ahead: AUD/JPY, AUD/USD, EUR/JPY, EUR/USD, other currencies [Video]
![Key trading levels for the week ahead: AUD/JPY, AUD/USD, EUR/JPY, EUR/USD, other currencies [Video]](https://editorial.fxstreet.com/images/Markets/Currencies/Majors/USDCAD/canadian-money-2670959_XtraLarge.jpg)
Overview
Duncan Cooper summarises the key trading levels of AUDJPY, AUDUSD, EURJPY, EURUSD, GBPJPY, and GBPUSD for the week ahead.
Last week AUDJPY, AUDUSD, EURJPY, EURUSD, GBPJPY, and GBPUSD all finished down for the week. The first trading day of July was very negative across all these pairs with AUDUSD closing below the 0.6826 monthly support level.
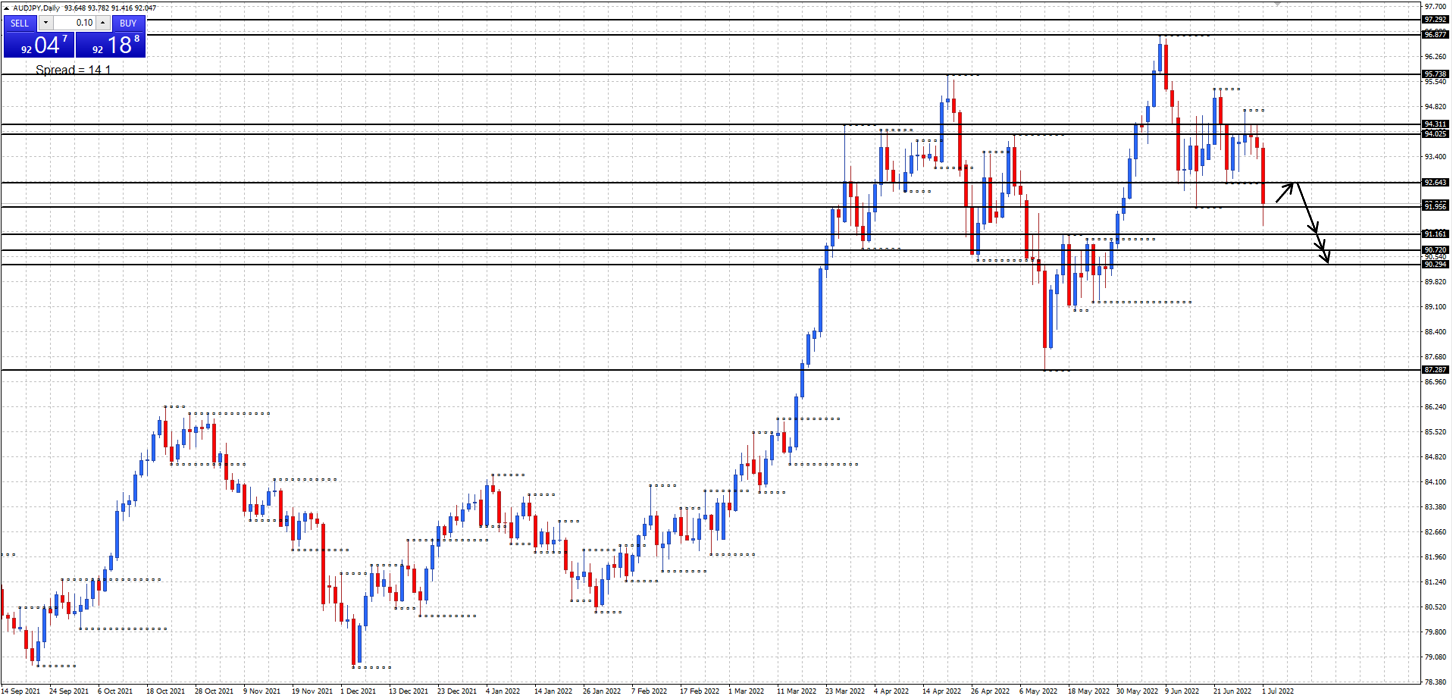
AUD/JPY daily chart
Monthly support at 90.72 and 90.29, resistance at 97.29.
Weekly support at 87.28, resistance at 94.31, 95.73, and 96.87.
Daily support at 91.95 and 91.16, resistance at 92.64 and 94.02.
Price declined down from the 94.02-31 daily/weekly resistance area last week. Will price continue to decline and retest the 90.72-29 monthly support levels this week?
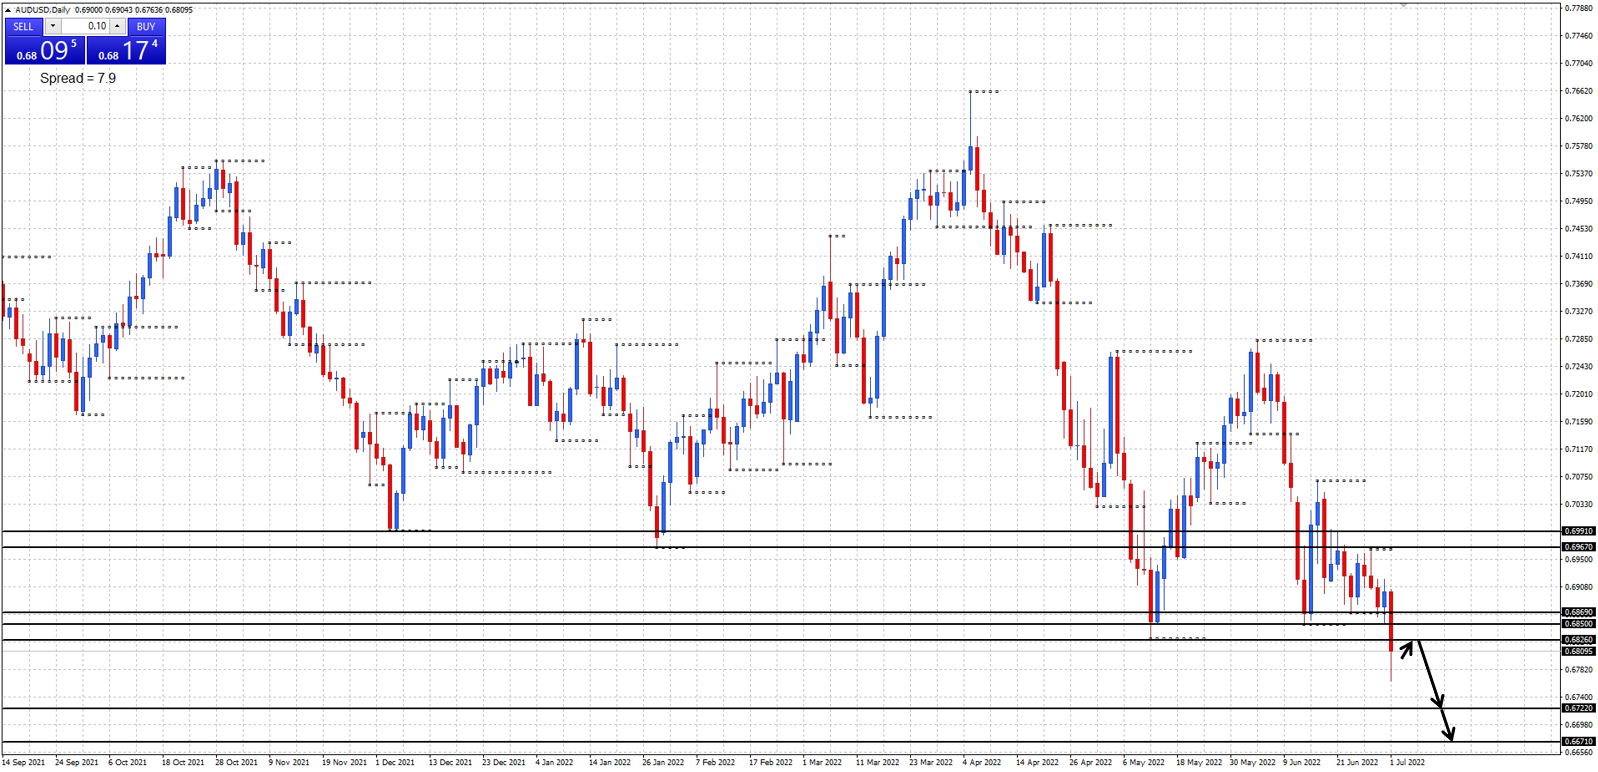
AUD/USD daily chart
Monthly support at 0.6722 and 0.6671, resistance at 0.6826, 0.6967, and 0.6991.
Weekly support at 0.6722, resistance at 0.6828.
Daily support at 0.6722, resistance at 0.6850 and 0.6869.
Price broke below the 0.6826 monthly support level last week. Will price continue to decline and test the 0.6722 and 0.6671 monthly support levels this week?
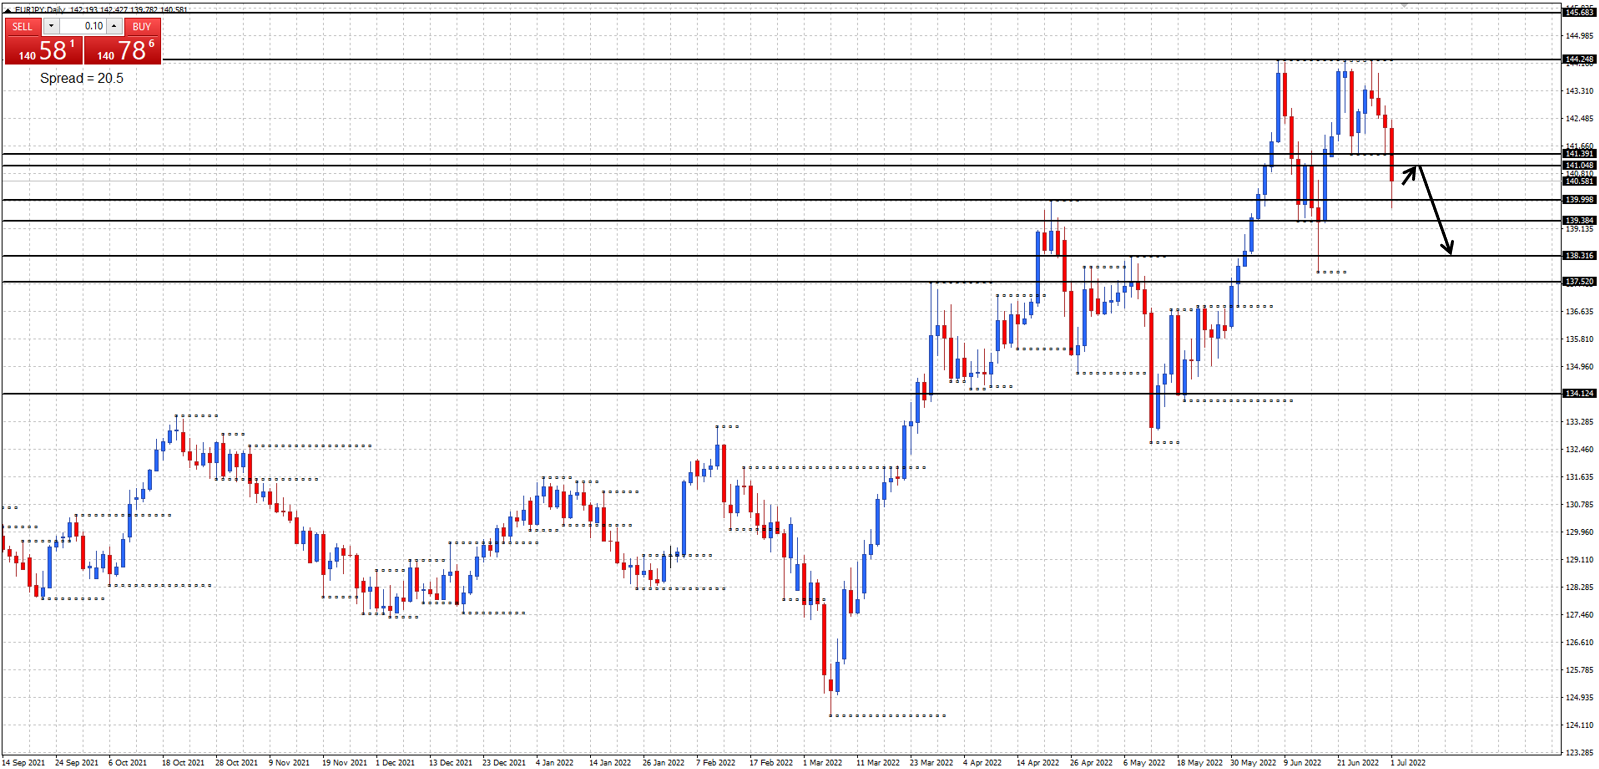
EUR/JPY daily chart
Monthly support at 137.49 and 134.12, resistance at 141.04 and 145.68.
Weekly support at 139.99 and 137.52, resistance at 144.24.
Daily support at 139.38 and 138.31, resistance at 141.39.
Price formed a triple top at the 144.24 weekly resistance level last week. Will price continue to decline and retest the 138.31 daily support level this week?
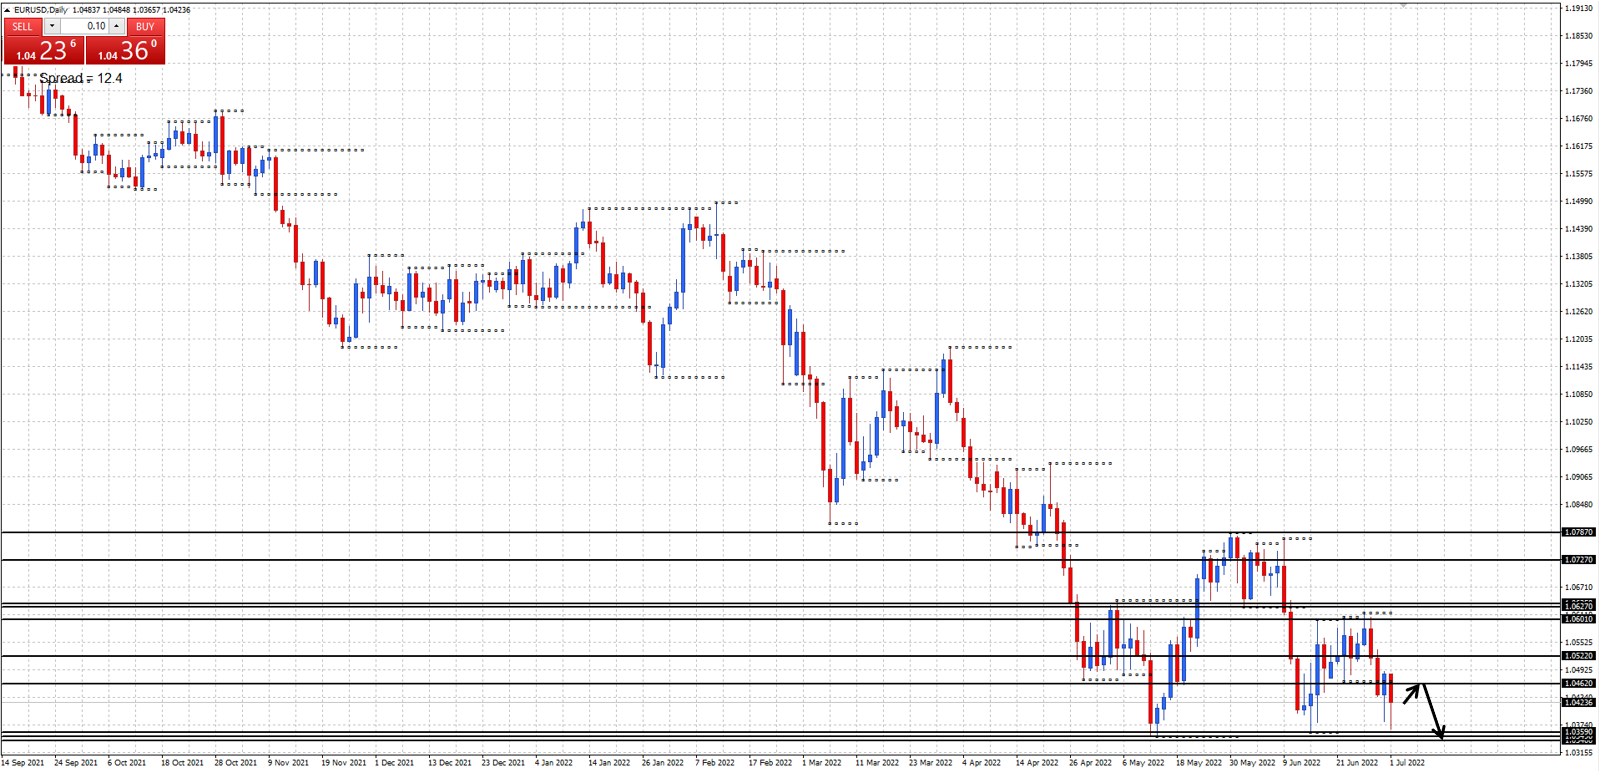
EUR/USD daily chart
Monthly support at 1.0340, resistance at 1.0462, 1.0522, and 1.0635.
Weekly support at 1.0349, resistance at 1.0727 and 1.0787.
Daily support at 1.0359, resistance at 1.0469, 1.0601, and 1.0627.
Price declined down from the 1.0601 daily resistance level last week. Will price continue to decline and test the 1.0340 monthly support level this week?
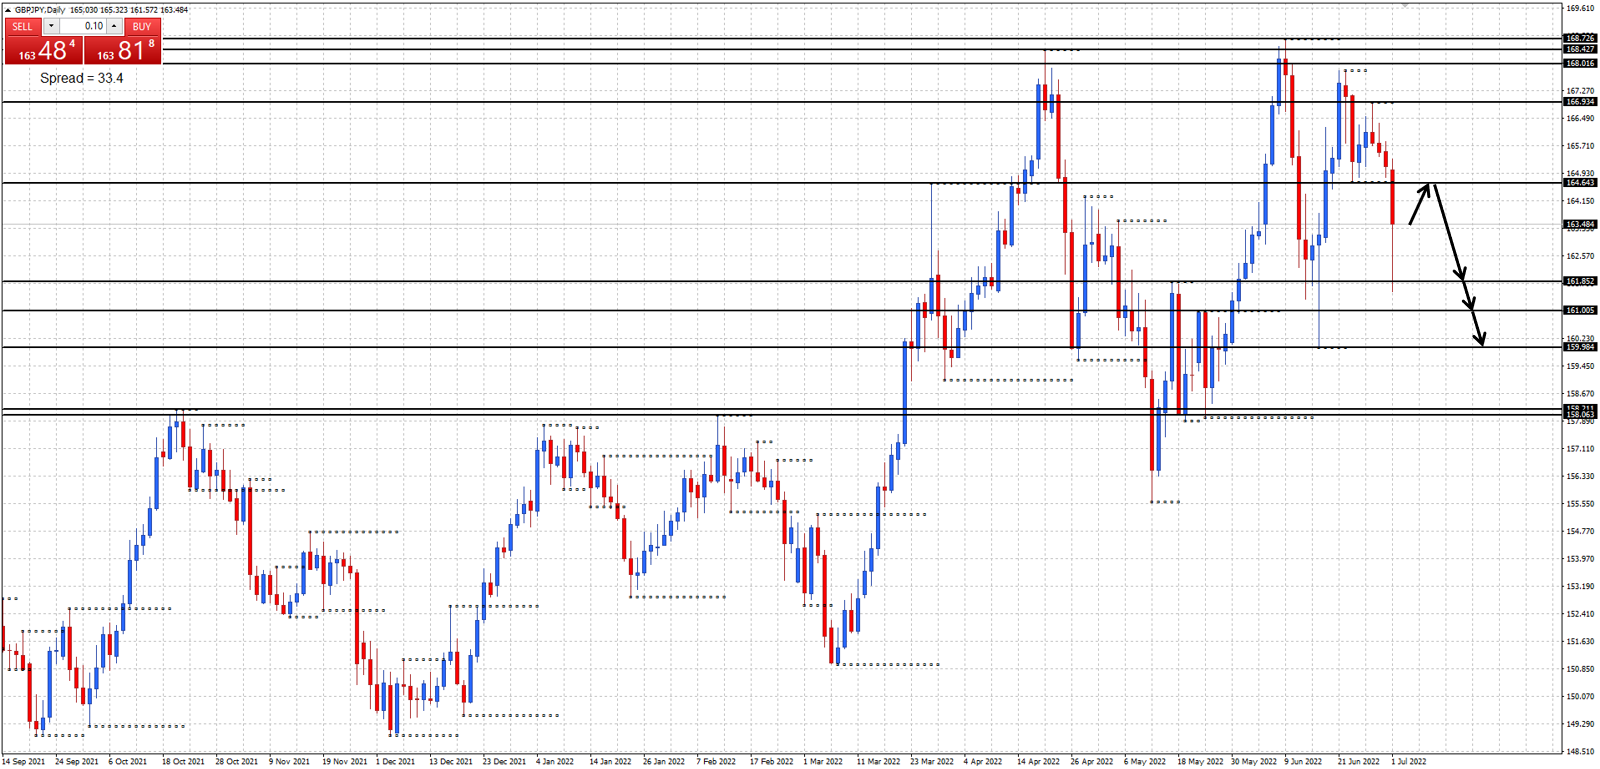
GBP/JPY daily chart
Monthly support at 158.21, resistance at 168.01.
Weekly support at 159.98 and 158.06, resistance at 168.42 and 168.72.
Daily support at 161.85 and 161.00, resistance at 164.64 and 166.93.
Price declined below the 164.64 daily support level last week. Will price continue to decline and test the 159.98 weekly support level this week?
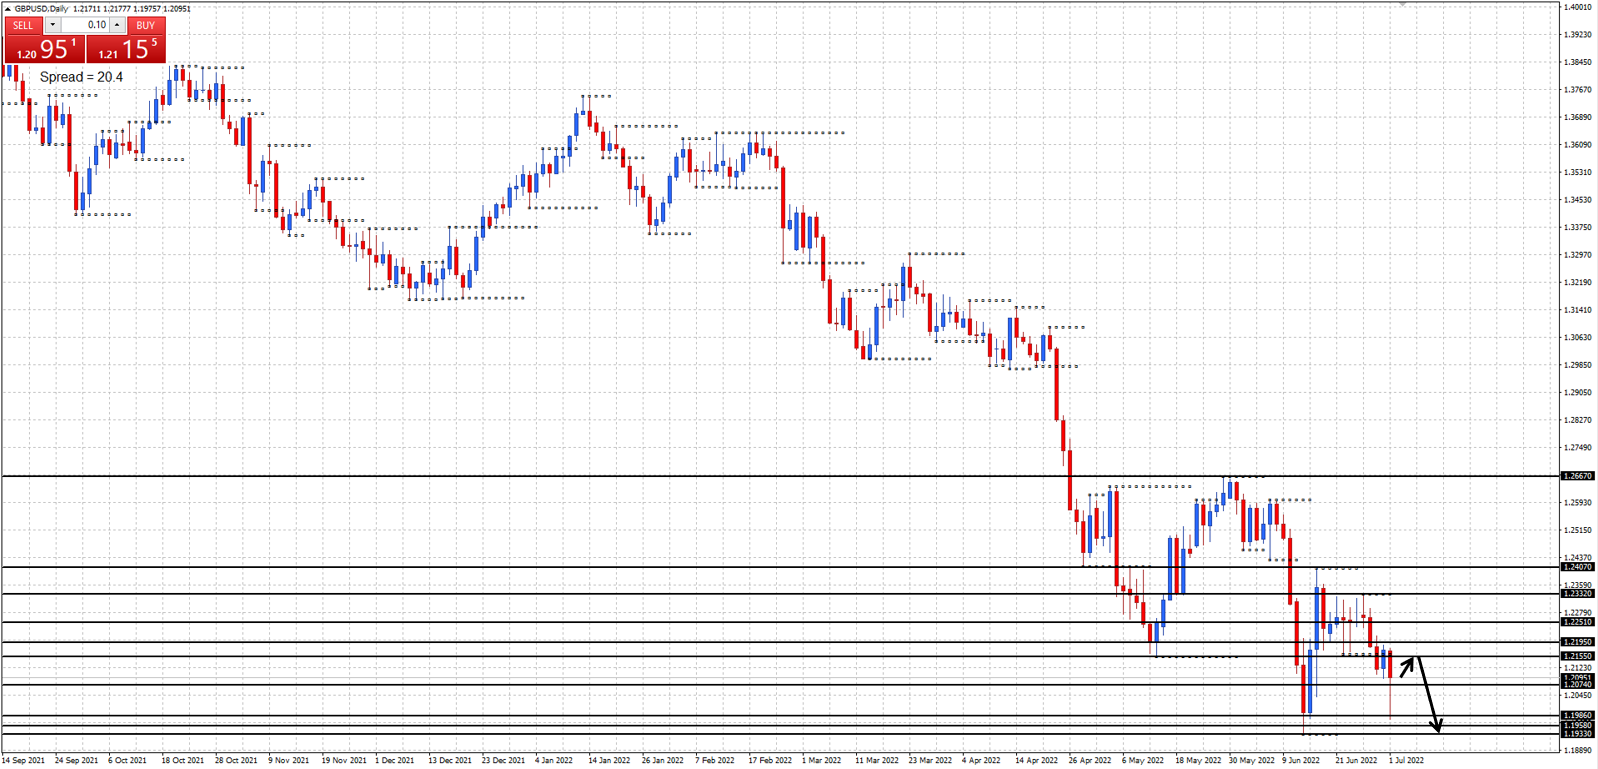
GBP/USD daily chart
Monthly support at 1.1986, 1.1958, and 1.1645.
Weekly support at 1.2074 and 1.1933, resistance at 1.2155, 1.2195, 1.2251, and 1.2667.
Daily support at 1.1933, resistance at 1.2161, 1.2332, and 1.2407.
Price declined and retested the 1.1986 monthly support level last week. Will price continue to decline and test the 1.1933 weekly support level this week?
Author

Duncan Cooper
ACY Securities
Duncan Cooper is a full-time trader and mentor. He has been actively trading the financial markets for more than 15 years and has traded stocks, options, futures, and the Forex Market since 2005.


