Key Support Being re-Tested

Market Overview
Chart Analysis (The charts that are shown below are courtesy of QCharts)
This market has been a real bear, lately! (Forgive the pun, but is itreally one?) While we do not have absolute confirmation that we have started a bear market -- and won’t until we begin to decline in earnest below 2604 -- all the evidence points to massive distribution taking place in a roughly 200-point range. SPX is again approaching the low of that range, and has even broken the last short-term low of 2731 intra-day, but it would have to drop another 30 points to make a new low and, since it is approaching the strong support level which stopped the decline last time in a short-term oversold condition with positive divergence showing in the indicators, odds are pretty good that this support will hold again. In addition, I have mentioned several times in my daily updates that we could expect another pull-back into about 12/10. Therefore, ending this short-term correction on Monday or Tuesday would be perfect.
And then what? Probably something similar to the last time; another short-term rally which could get the index back up to at least 2800 in order to create additional distribution before we get started on the potential 700/800-point biggy! Watching the combined daily and hourly indicators has always been the best way to identify short-term tops and bottoms (usually pre-determined by P&F and Fib. measurements), but in this atmosphere of extreme volatility, the reversals come at a rapid rate.
SPX daily chart
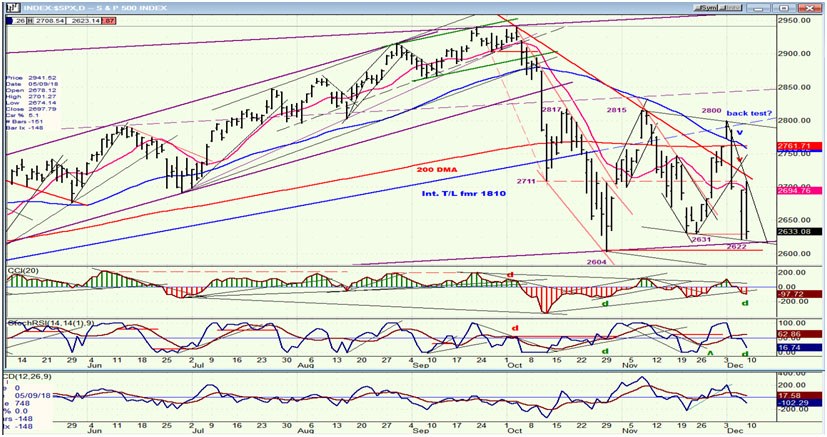
Since the last rally stopped on the extension of the trend line from 1810, we can probably assume that this was a back-test of that trend line. However, I am not so sure that we will stop there next time, especially if we add to the P&F base which is already in place. Of course, if we drop below 2600 before rallying, it would change expectations for the timing of this next rally, but if we hold above, we could easily surpass the 2800 level on the next move. No point getting too specific now, though. Let’s wait and see how much more of a decline we get before we start our rally.
Drawing a trend line from the January top to the September top, and then a parallel to that line across the February low gives us a broad lateral channel which pretty much defines the topping range of the uptrend which started at 1011 (wave 3) and that we have now begun to correct. The bottom channel line is where support lies. This is the third trip to that area and, considering that the daily momentum indicators are still declining but are beginning to show positive divergence, as is the A/D differential indicator, it suggests that we are likely to hold support again before starting our Xmas rally; especially since this process is far more advanced in the hourly indicators, as we will see on the hourly chart. Like the last two rebounds, the next rally is unlikely to reach all the way to the top of the channel which would create a new high; but a move to about 2850 is possible. This is where price would meetthe resistance caused by the dashed parallel to the channel lines.
SPX hourly chart
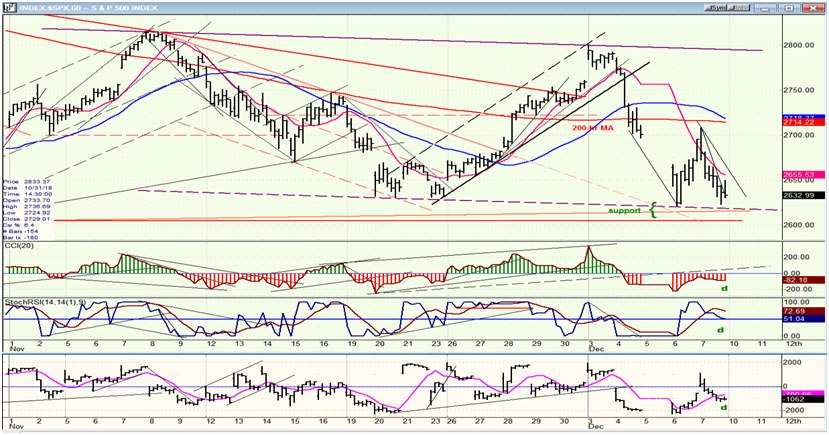
Wednesday’s market close has created a 7 hour gap in the chart, which makes it a little more complicated to analyze but not impossible since enough bars wereprinted over the last two days. In the daily chart section, I mentioned a wide lateral channel whose (orange) bottom line had already provided support for prices on previous occasions, and may again, this time. But there is another smaller channel line (dashed-purple) which should also help contain the decline from 2800.
I also mentioned that the indicators, although they were also affected by the gap, were showing credible strong positive divergence which would require another prolonged drop in prices to eradicate. Since this divergence is occurring as we approachthe date (12/10) which was suggested as a low for the minor correction, and taking place at a price level which has proven to be good support, we should be expecting a reversal to take place in this area. The base which has been formed on the P&F chart by the double bottom is already capable of carrying the next rally past the former short-term top, and with the final price gyrations extending the count by a few more points, there should be enough accumulation to take the index to about 2850.
Note that the divergence is not only showing in the momentum oscillators, but in the A/D indicator as well, as it is a the daily level.
DJIA, SPX,IWM, NDX (daily)
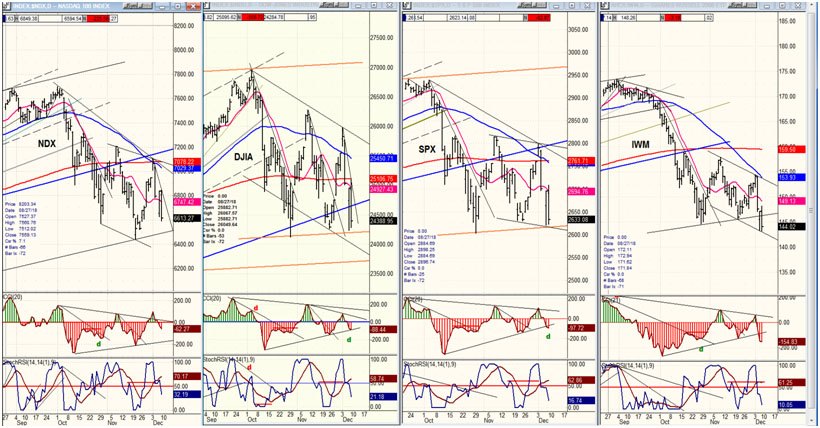
As a result of last week’s market action, the short-term relative strength ranking has again changed, with NDX resisting the current decline better than the other three indexes and moving into first place, while IWM made a new low and reverted to the last position. The relative strength of the techs could also be a sign that we are ready to reverse the short-term trend once again.
UUP (Dollar ETF)
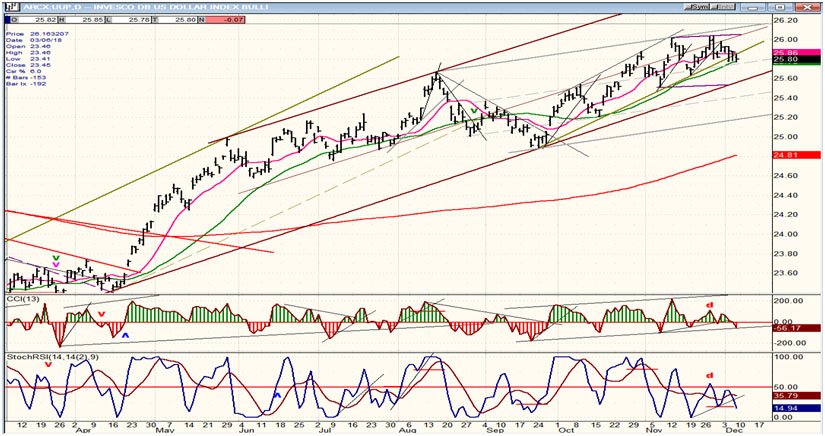
UUP is giving increasing signs that it is starting to correct. On Friday, it closed outside, if barely, of its minor trend line for the first time since making a short-term double top. But the momentum oscillators are where the reversal which is slowly taking shape can best be seen -- especially the lower, more sensitive one which started displaying negative divergence a month ago and which has been negative for the past two weeks.
UUP has been very resistant to even the slightest weakness and, even if it starts to pull back right away, it may confine its correction to about 25.50 over the near term.
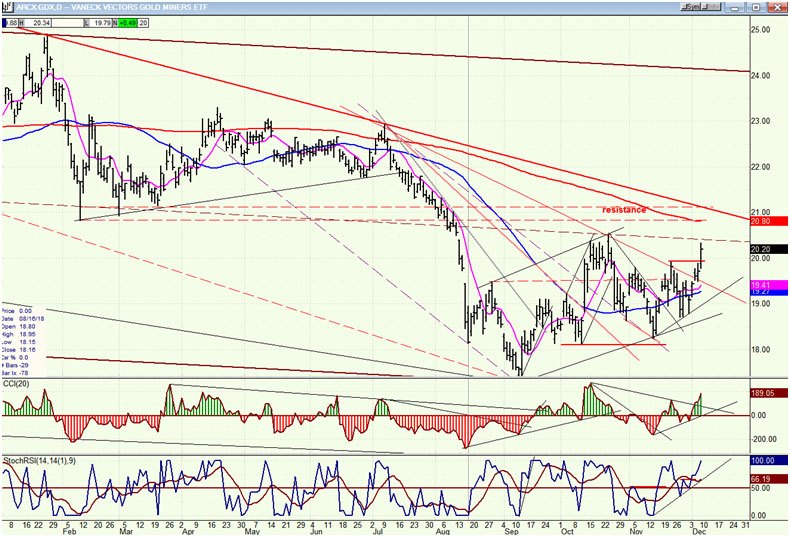
GDX (Gold miners ETF) daily
As UUP is beginning to show some weakness, GDX is starting to move up, and getting ready to exit its congestion area. Any more weakness in the former will help GDX to reach 21-21.50, which is the minimum projection out of its base. Should UUP decline below 24.50, GDX could continue its rally to about 25.00.
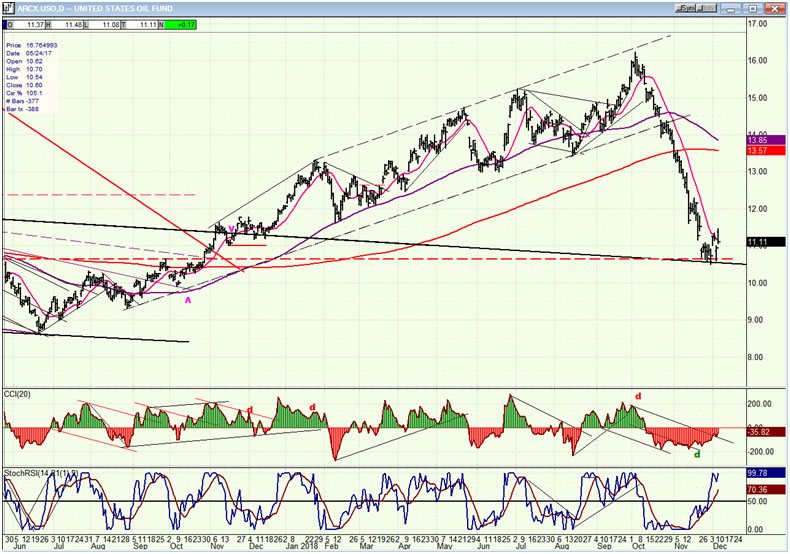
USO (United States Oil Fund) daily
USO is finding support on the trend lines drawn on the chart. If it can move past 11.50, it could start to build a base at this level.
Summary
Despite the selling pressure of the past two weeks, SPX could again find support above its 2604 low, and remain in its broad trading range for a while longer; at least for the rest of the month of December. Next week should confirm whether or not it is ready to launch its seasonal Christmas rally.
Author

Andre Gratian
Market Turning Points
When I was a stock broker years ago, a friend introduced me to technical analysis of the market and it is not an exaggeration to say that I fell in love with this approach! Ever since then, it has become an increasingly important


