Key (Short-term) Support Holds

Market Overview
Last Week: SPX is approaching a support level just above the former low of 2604. Perhaps for this reason, or because of the Thanksgiving holiday, breadth was relatively bullish in the last couple of days. Does that mean that it will hold in this area beforestaging a good rally?
This Week: From last Friday’s low, the index has already rallied about 130 points and may be ready for a consolidation before moving higher. The odds that this is the beginning of a rally which will take us to a new all-time high are slim to none. The bigger picture still suggests that the sharp 337-point decline from the high of 2941 was the beginning of an intermediate correction which will, in retrospect, be severe enough to deserve being called a bear market. Last week’s letter stated that the most logical extent of the correction for the SPX would be a decline of 700 to 800 SPX points over the next year or two. This would be the equivalent of about 7000 points on the DJIA. But before we embark on the main body of the correction, we need to form a top which will be proportional to the coming decline. This is probably what we are engaged in doing, right now.
After reaching its January high of 2873, SPX had a sharp correction to 2533 which was followed by a less aggressive rally to 2941 to conclude the uptrend which started at 1011 on 6/27/10. That uptrend which measured almost 2000 SPX points represents a complete market wave which we have just begun to correct. Viewed from that perspective, a “consolidation” of about 800 points before the next uptrend gets underway does not look unrealistic. It’s like saying that a 20-point rally will now have an 8-point pull-back. After that correction, the market should ideally fetch an even higher high past 2941 before having an even longer and deeper correction than the one which lies more immediately ahead. Of course, there are no guarantees that the current correction will be that deep -- or even that shallow, for that matter! It’s also possible that the market will deviate from a somewhat predictable course and that we are starting the “mother of all bear markets”, something comparable to what happened in 1929 but proportionally bigger. As we move forward, the long-term swings get progressively larger in size. This is what history shows.
Chart Analysis (The charts that are shown below are courtesy of QCharts)
SPX daily chart
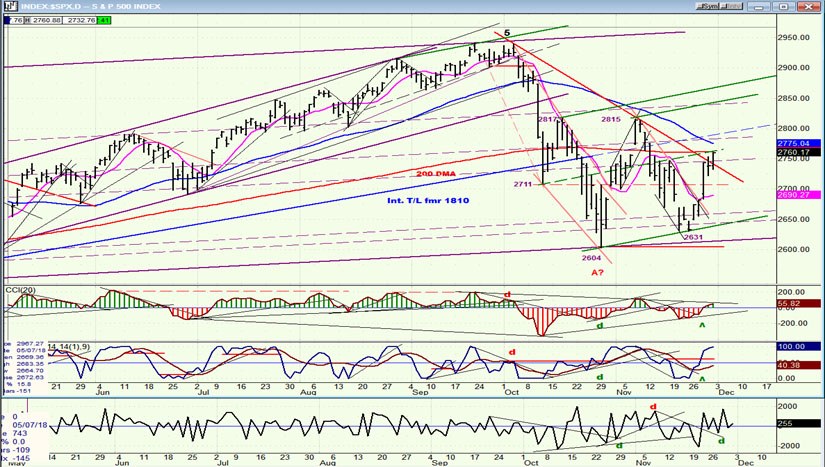
With a rally startingfrom a level a little above the former low, it is possible that 2604 can be labeled as wave A and that we are now in a B wave. However, there is no rush toattach labels. If we wait until the structure is more developed, we have a better chance of beingright. Since this is a longer-term pattern, it may take a little longer for the correct structure to reveal itself.
In the meantime, we can use other forms of technical analysis to determine the path that the market is taking. Looking at the top of wave 5, the last two tops are connected by a short, green trend line. A parallel to that trend line drawn across the 2604 low provided support for the recent test. When prices fall below it, it is likely that this will be followed by a new low. But for now, we are in a short-term uptrend which originated at the 2631 level and which should keep moving higher before that level is in danger. On Friday, the index rose to reach another parallel to that green trend line drawn from 2711. This could provide some resistance, especially since this is also the level of the 200-dma which had been penetrated to the downside during the original decline. Note also, that a little higher, the index will meet the descending blue 50-dma. This would therefore be a good areain which the current rebound takes a breather. However, since Trump and the Chinese president are meeting (as I write this) to discuss the trade situation, near-term prices can be influenced by the result of their negotiations.
I have also drawn other short-term (green) parallels from the two former highs of 2815 and 2817. There is a good chance that this is where the current rally will come to an end since the indicators suggest it has farther to go, even if there is a pause in this area.
SPX hourly chart
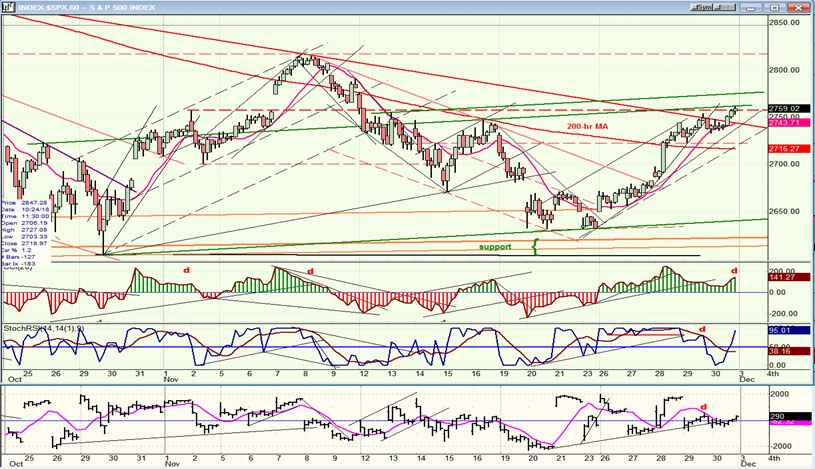
The index has now broken three downtrend lines in succession -- the last one on Friday. News that the meeting in Argentina was positive (although no details have yet been given) could push prices higher on Monday morning. The nearest green parallels which could provide resistance are also drawn on this chart.
The indicators are all in an uptrend, but negative divergence in the CCI, as well as limited participation by the A/Ds, are suggesting that we could be near a top. However, this may be due to unwillingness on the part of traders to be too aggressive until the results of the talks are known. Even if there is a pull-back from this level, a sell signal would not occur until the top oscillator turns red and until the index comes out of its uptrend and channellines,both of which are still several points away. Furthermore, a pull back in the hourly oscillators would only create some deceleration in the daily but would not be enough to turn them around. Most likely, at least one more set of positive hourly indicators (after an initial minor correction) would be required before negative divergence shows on the daily CCI, ahead of its turning negative. This is why I am suggesting that a top in this short-term uptrend is probablystill 2 or 3 weeks away.
DJIA, SPX,IWM, NDX (daily)
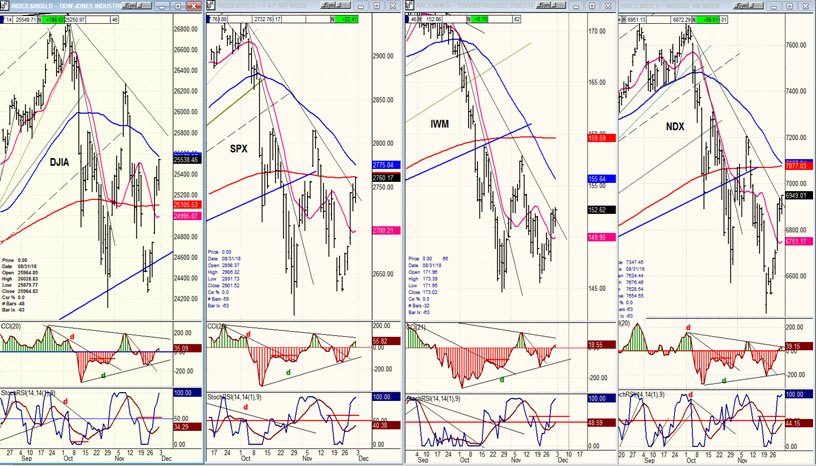
Since it is the only one to have broken its October low, NDX remains the weakest index. Otherwise, the November rally is affecting all four indexes about equally. This should continue until we get closer to the end of the rally where some relative weakness may start to show in IWM.
UUP (Dollar ETF)
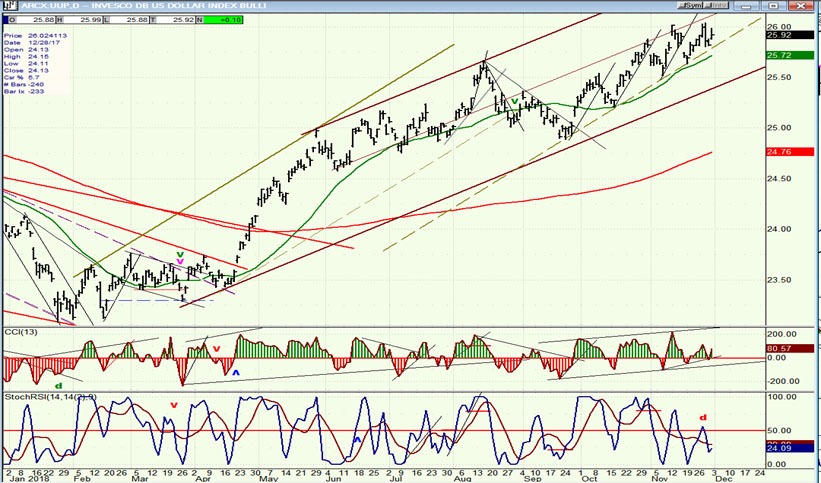
UUP is looking toppy, short-term. This shows up best in the daily indicators where increasing negative divergence has taken place over the past three weeks. Perhaps a pull-back toward 25.50 is in order. UUP is a very slow moving index and the current pattern does not warn of anything close to a major reversal taking place in the near future. The dashed trend line is vulnerable to being broken, but there should be support at the solid trend line. The weekly indicators remain strong, but overbought.
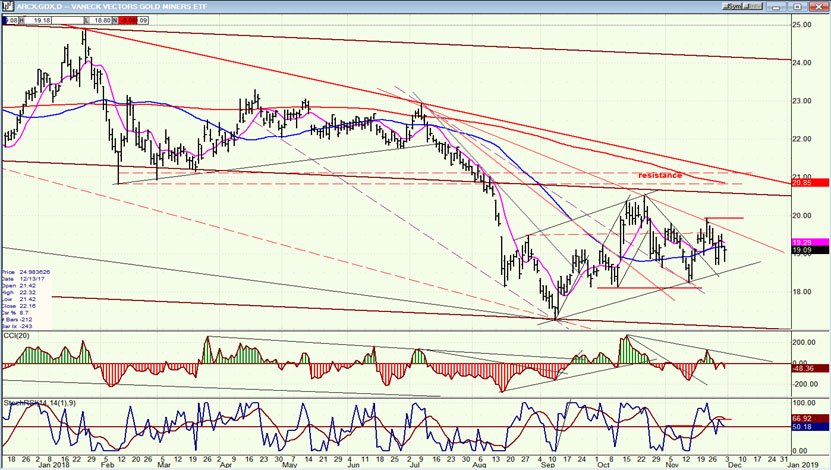
GDX (Gold miners ETF) daily
The last two minor pull-backs in GDX were arrested before they could do technical damage. If the index can now surpass the small red horizontal trend-line, it should also challenge the red down trend line from about 25.00 and finally reach the 21-22 level in order to begin a reversal process. But price appreciation is likely to be limited by the amount of weakness that the dollar is capable of developing at this stage. Progress should also be curtailed by important intermediate cycles bottoming over the next couple of months, although one of them may already have made its low.
USO (United States Oil Fund) daily
USO has registered greater weakness than anticipated after reaching its October peak. It retraced back to what should be fairly solid support but it is not likely to start another significant uptrend until it has built the kind of a base that can support it. This may take a while.

Summary
Longer-term, SPX is most likely tracing out an important top before it starts (resumes) a correction taking it significantly lower. Only long-term investors will debate what lies ahead, but even at best, the anticipated decline could amount to several hundred more points. Shorter-term, the index is engaged in a period of distribution which should keep it in that range for several more weeks
Author

Andre Gratian
Market Turning Points
When I was a stock broker years ago, a friend introduced me to technical analysis of the market and it is not an exaggeration to say that I fell in love with this approach! Ever since then, it has become an increasingly important


