Just how high can Gold soar?

How high can gold go?
The truth is that nobody can tell with 100% certainty. Truth be told, it’s near impossible to get out/in exactly at the market extreme, and the fact that we were able to do that at the 2020 bottom doesn’t mean that this will be the case each and every time.
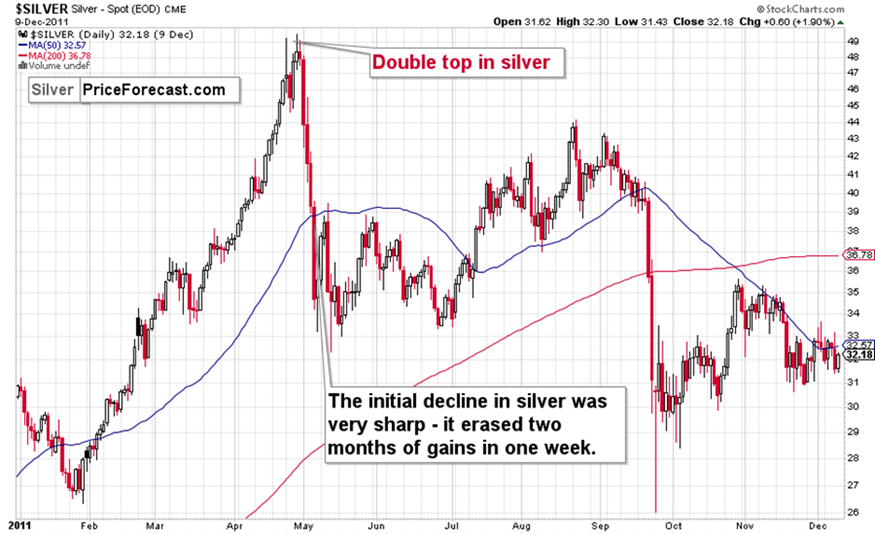
But, given this kind of volatility, getting out a few days ahead or even a week ahead of the top doesn’t change that much, as the same – or (more likely) even bigger – volatility will be seen on the downside, and the rally that we see right now will be erased very quickly. Remember what happened in silver in 2011 – two months of gains were erased in just a week.
Long-term Gold targets already hit
And gold’s upside targets?
They were already reached – even the long-term ones.
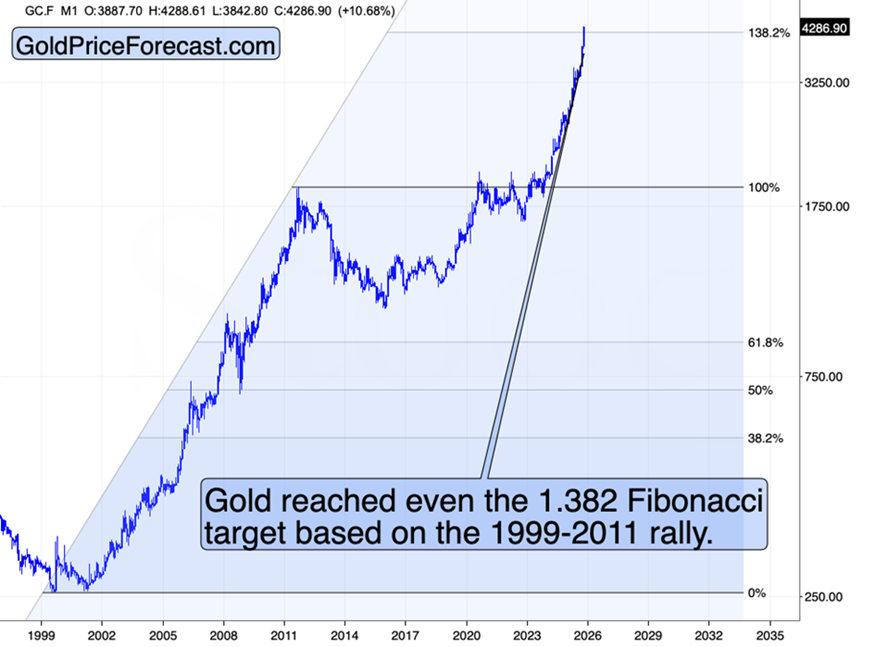
On the above chart, we see that gold moved to – and even a bit above – its 1.382 Fibonacci extension based on the 1999 – 2011 bull market.
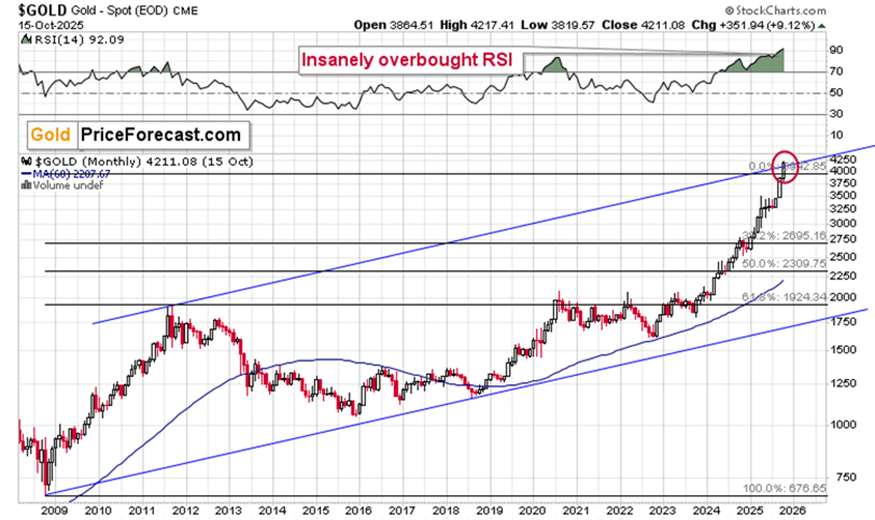
It’s also at – actually a bit above – the upper border of its very long-term, rising trend channel. All this while being extremely overbought. And while the USD Index is just waiting to soar.
All this creates a situation in which all those recent big gains can be reversed shortly and followed by even bigger and more volatile declines. Those are not short- or medium-term indications – those are super-important resistance levels that were reached (and then broken). The declines that follow tops of this importance don’t tend to be small or shallow.
This might not be that important for those holding gold for the long run in their retirement accounts, but if a $1000+ decline in gold seems important to you, I think it’s good to pay attention to how extremely overbought gold and silver have become.
Remember – we saw a similar rally in 2011, and back then, silver erased two months of gains in one week. If so, even if gold and silver are still rallying today, given gold’s long-term situation, it looks ready to top and slide any day now. Even if it doesn’t top this week, it seems extremely likely to me that we’ll have the 2025 top later this month.
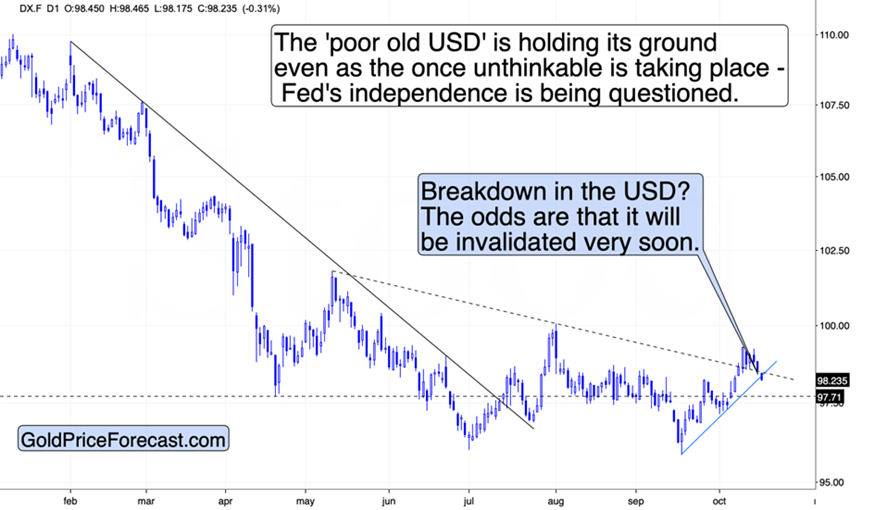
Here’s one idea for a trigger – an invalidation of the tiny breakdown in the USD Index.
USD index reversal as a potential trigger
The USD moved below its declining, dashed support line and the rising, short-term support line. This breakdown is unlikely to hold given how strong the USD Index has recently been despite all that was thrown at it. Right now, we once again have the tariff and trade threats between the U.S. and China, but while these previously triggered sharp declines, it has now generated only a small move lower.
What’s likely to happen next? Some kind of de-escalation, and if not, at least stabilization. Even the latter would be enough for the USD to move higher.
There’s one additional possibility, and that is that the USD Index could reverse at the moment when both support lines cross – which is due today or tomorrow, depending on which intraday low one uses for the October low for the rising support line.
The triangle-vertex-based reversals are common and often accurate. This vertex could be the spark that ignites the bearish fire in the precious metals sector.
How high can gold go? The point is that it doesn’t matter that much if it’s about to reverse and fall faster than it had rallied.
Want free follow-ups to the above article and details not available to 99%+ investors? Sign up to our free newsletter today!
Want free follow-ups to the above article and details not available to 99%+ investors? Sign up to our free newsletter today!
Author

Przemyslaw Radomski, CFA
Gold Price Forecast
Przemyslaw Radomski, CFA (PR) is a precious metals investor and analyst who takes advantage of the emotionality on the markets, and invites you to do the same. His company, Sunshine Profits, publishes analytical software that any


