Just how bad is Uncle Sam's interest problem?

The U.S. government has an interest problem.
Just how bad is it?
Really bad.
Most people intuitively understand that massive budget deficits aren’t sustainable. They recognize you can’t live indefinitely on a credit card.
Granted, it is fair to say government finance isn’t the same as personal finance, nevertheless, Joe Sixpack’s intuition is on target. Uncle Sam can’t keep borrowing and spending at the current pace forever. Eventually, the debt bubble will pop, and that moment looms closer with each passing day.
We’re starting to see warning signs.
After Moody’s downgraded the U.S. credit rating, bonds sold off, causing interest rates to spike. The 10-year Treasury yield surged to nearly 4.6 percent, and the 30-year approached a level not seen in nearly 18 years. This reflects waning demand for U.S. Treasuries.
And it makes sense. Would you loan your drunk uncle with a spending problem more money?
The slide in demand for Treasuries exacerbates a growing problem for the federal government. In simple terms, it means the government’s borrowing cost is rising. The more interest Uncle Sam has to pay, the more money has to borrow, creating an upward spiraling feedback loop.
How much is the government spending on interest
Interest expense is already getting out of hand.
Interest on the national debt cost $101.7 billion in April alone. That brought the total interest expense for the fiscal year to $684.1 billion, up 9.5 percent over the same period in 2024.
So far, in fiscal 2025, the federal government has spent more on interest on the debt than it has on national defense or Medicare. The only higher spending category is Social Security.
Uncle Sam paid $1.13 trillion in interest expenses in fiscal 2024. It was the first time interest expense had ever eclipsed $1 trillion. Projections are for interest expense to break that record in fiscal 2025.
The United States has the highest debt interest payment to GDP ratio of any developed economy. It’s currently around 4.6 percent. That’s ahead of Greece at a mere 2.5 percent.
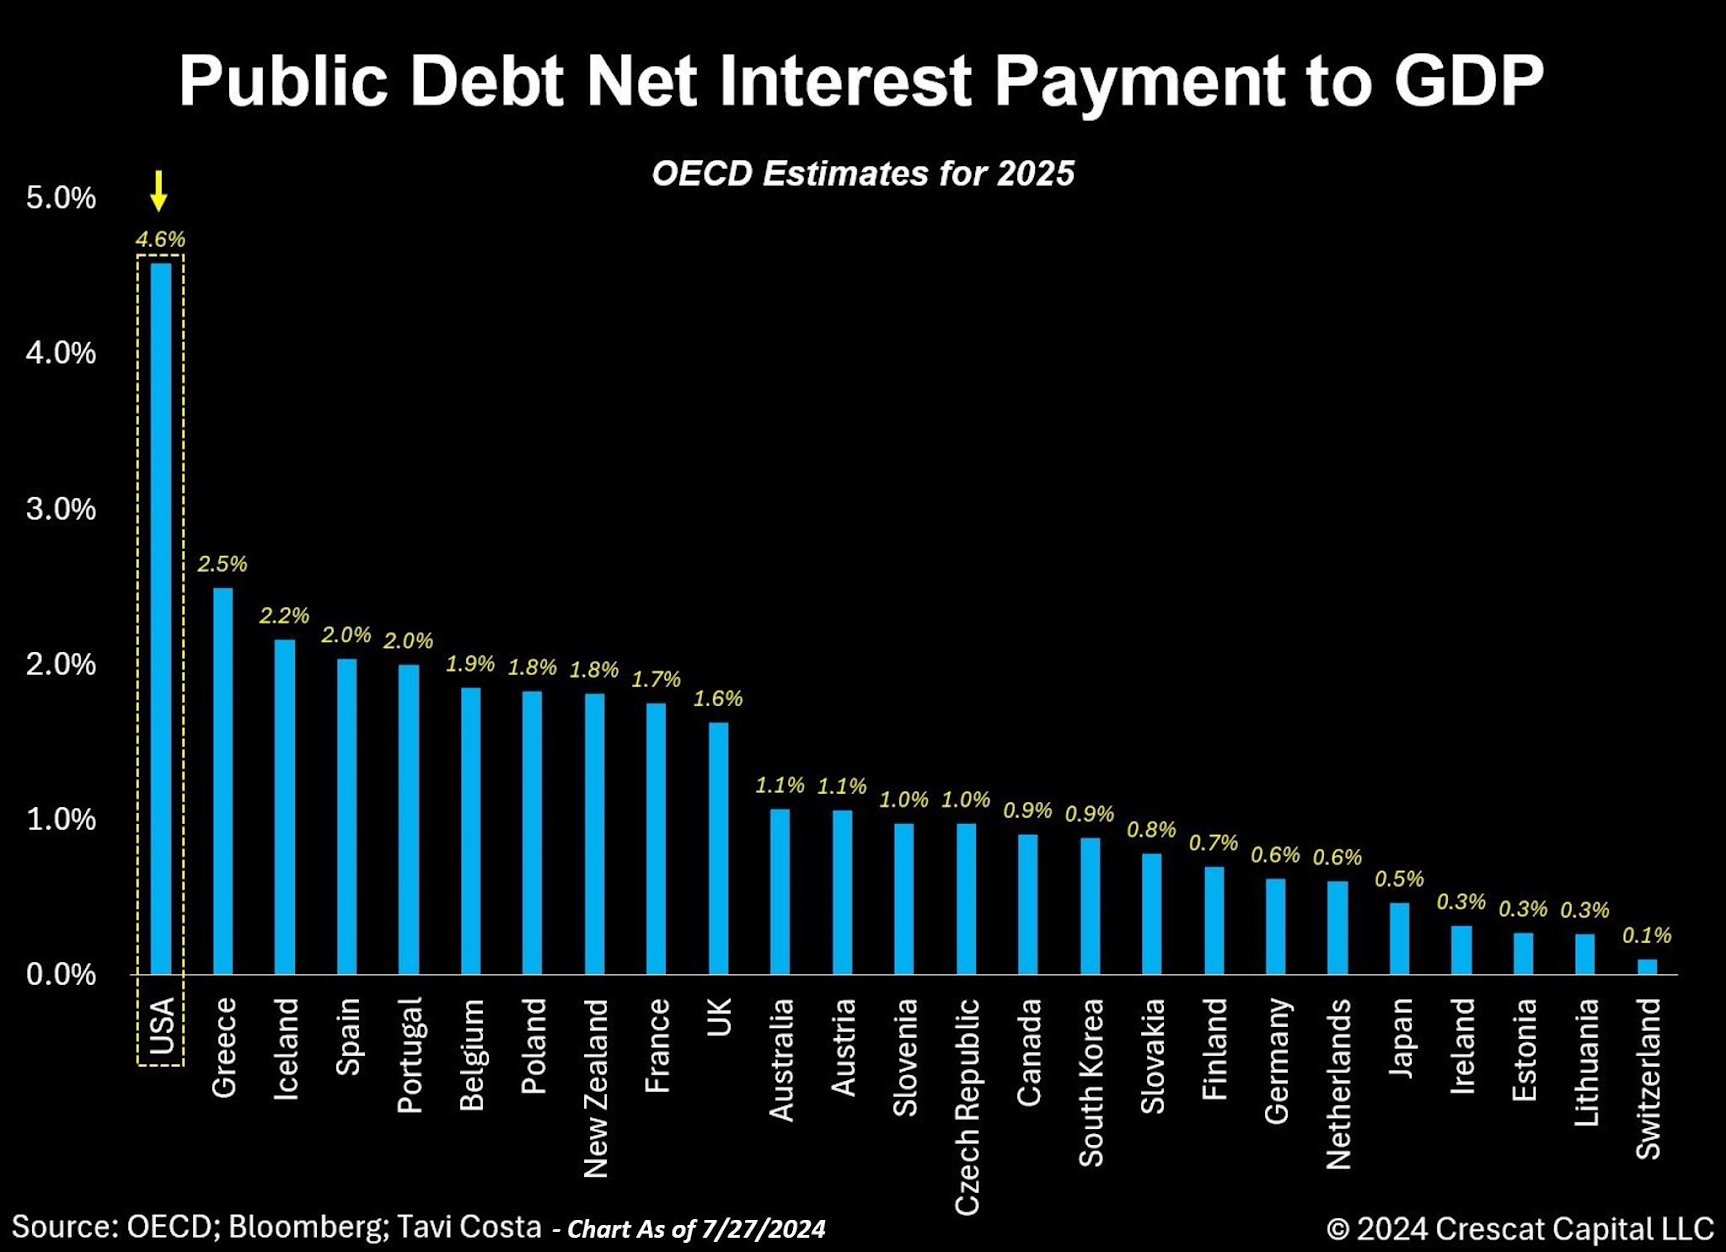
How's that for "America First?"
The interest problem is only going to get worse
Interest expense is rapidly increasing because debt that was financed when the Fed had rates pushed to zero is maturing. The federal government can’t just pay those bonds off. It must borrow more money to pay back prior borrowers. This maturing debt is being refinanced at much higher rates.
And there is a lot of debt to be refinanced coming down the pike.
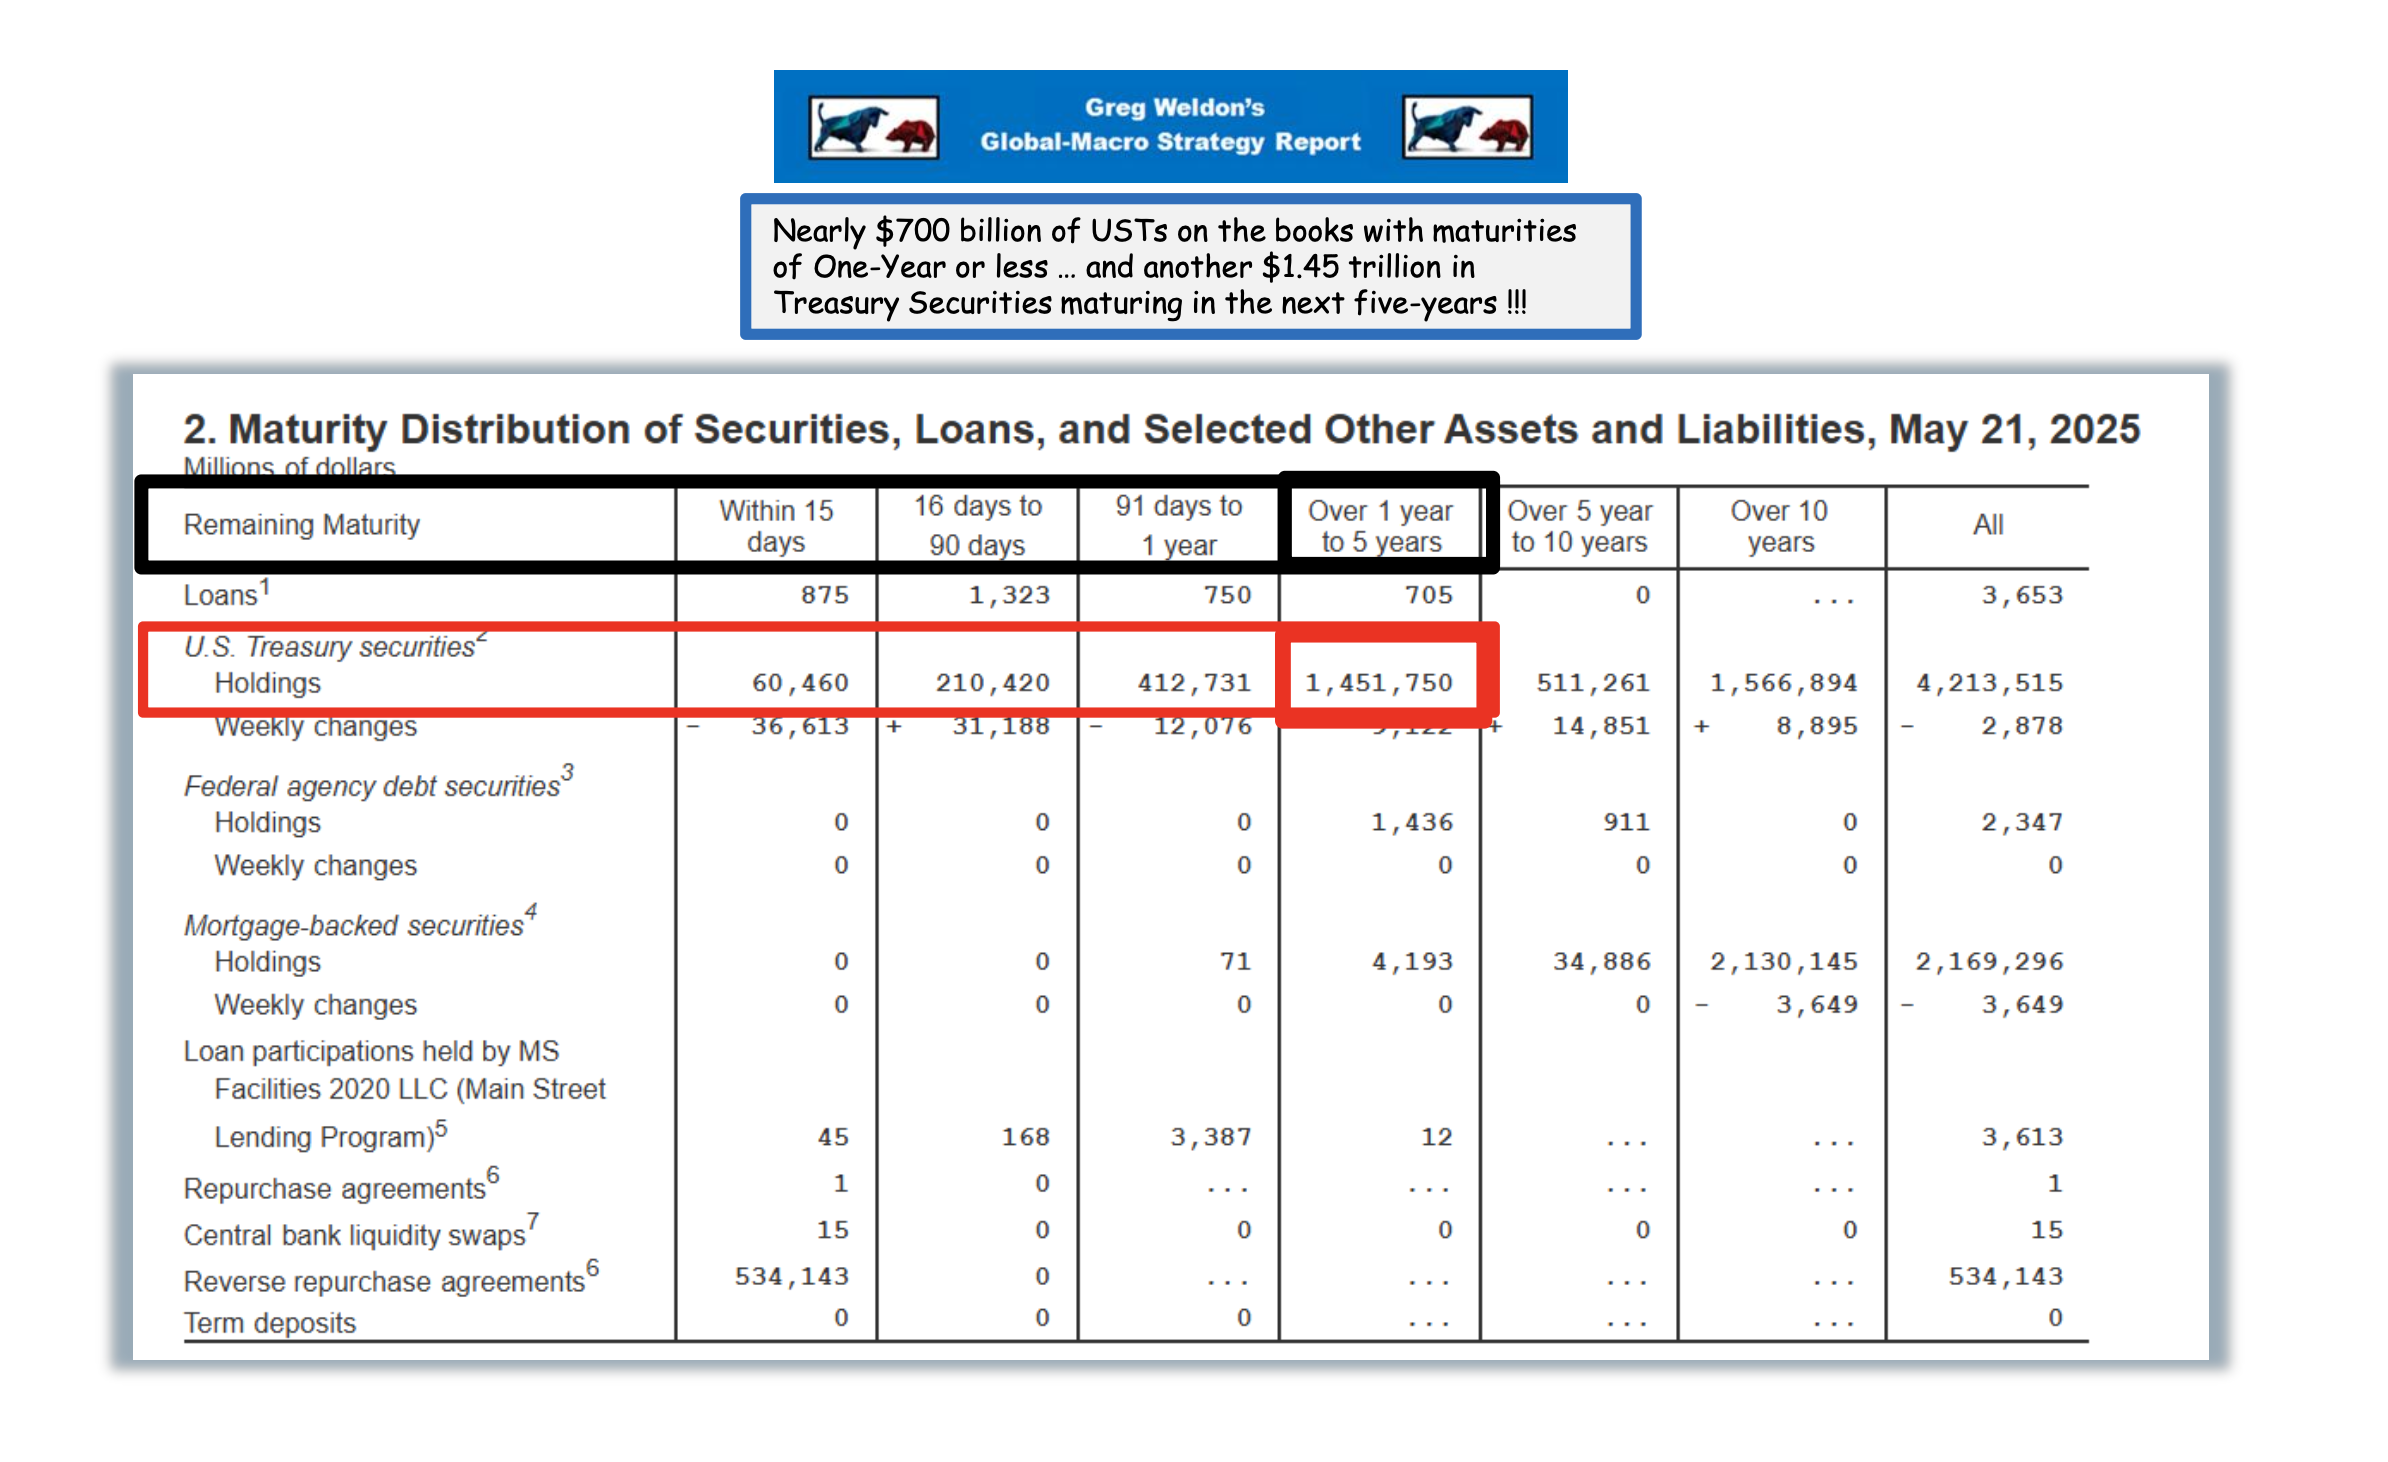
There are nearly $700 billion in Treasuries on the Fed’s balance sheet alone with maturities of one year or less, and another $1.45 trillion maturing in the next five years.
In all, about a third of the public debt, totaling $9.3 trillion, will mature by the end of Q1 2026. More than $3.1 trillion set to roll over in that period was issued more than two years ago, meaning it will be refinanced at much higher rates.
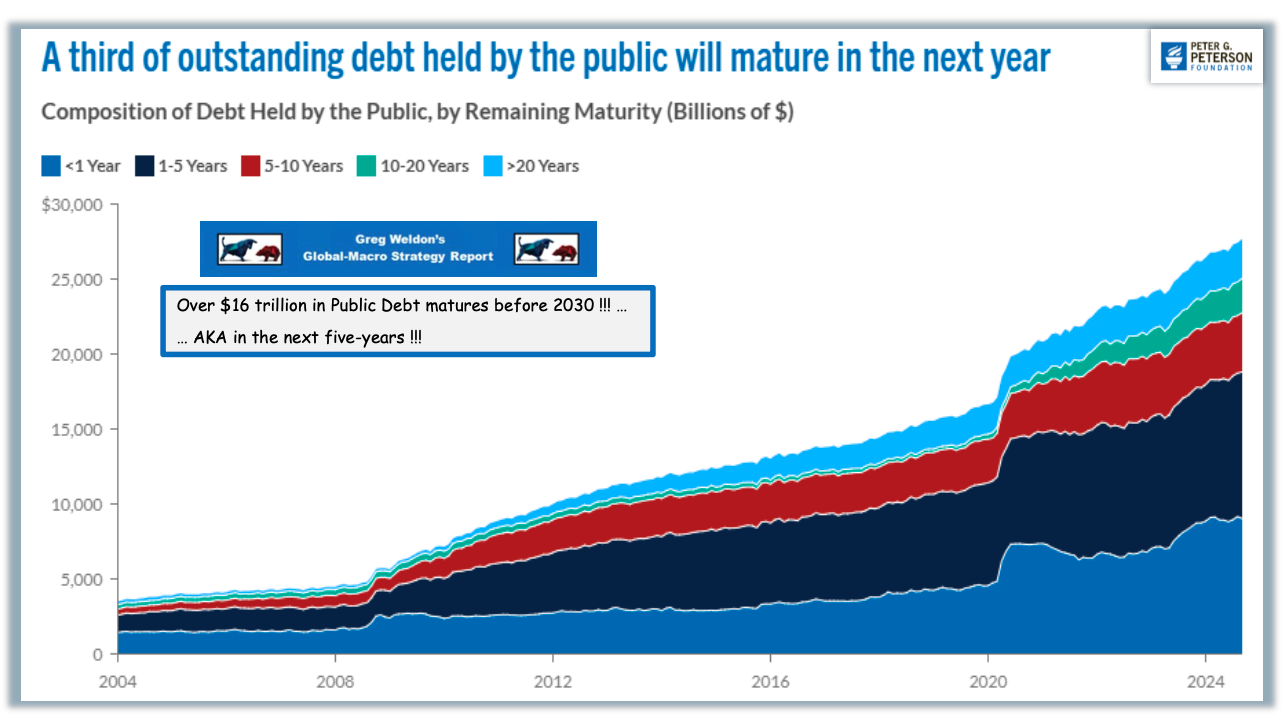
Analyst Greg Weldon calls this a debt tsunami.
The projected 10-year net interest cost is $13.8 trillion. That is more than the entire national debt before 2010.
Where is the off-ramp here?
Where is the off-ramp?
There isn’t one.
This highway is going off a cliff, and we passed the last exit a long time ago.
Some people think the Federal Reserve can intervene with rate cuts and mitigate Uncle Sam’s interest problem. But the fact is, the Fed has little control over the long end of the yield curve. This was apparent when Treasury yields spiked even after the Fed cut rates last year.
That leaves one option – monetize the debt.
What does that mean?
In a word --- inflation.
I’m talking about quantitative easing (QE). The Fed can ease the pressure on the bond market by buying Treasuries and holding them on its balance sheet. This “demand” pushes prices up and yields down.
In effect, QE turns Uncle Sam's debt (Treasury notes and bonds) into cash. This enables the U.S. government to borrow more money at lower rates than it otherwise could under normal market conditions.
This is exactly how the government was able to borrow so much money during the pandemic. Between the time it launched QE in March 2020 and May 2021, the Fed purchased a staggering $2.44 trillion in U.S. government bonds. In effect, the central bank monetized more than half of the U.S. debt accrued.
No other entity bought more U.S. bonds than the Fed – not foreign investors, not U.S. banks, and not even U.S. corporations and individuals.
In effect, the Fed put its big fat thumb on the bond market.
The problem is that the Fed runs QE with money created out of thin air.
With a few keystrokes, the central bankers at the Fed transfer money that never existed until that moment to a bank or financial institution in return for securities.
The central bank then holds these assets on its balance sheet, having injected the newly created money into the banking system. The effect is to increase the money supply, incentivize borrowing, and drive interest rates lower. Banks can take this newly minted cash and make loans. This increases overall liquidity in the financial system and theoretically stimulates lending, boosting the broader economy.
Keep in mind, inflation properly defined is an increase in the money supply. So, when the Fed creates money out of thin air, it is driving inflation.
Ironically, QE also incentivizes debt, which is exactly how we got into this situation to begin with.
The overall long-term impact of QE is overwhelmingly negative. It distorts interest rates, incentivizes massive levels of debt, creates misallocations of economic resources, and blows up bubbles throughout the economy. Eventually, the bubbles burst, and the debt becomes unsustainable, leading to a bust.
So, yes -- the national debt matters. And the proverbial chickens will come home to roost. It's just a matter of time. They are playing a game of kick the can down the road. The question is: how long is the road?
To receive free commentary and analysis on the gold and silver markets, click here to be added to the Money Metals news service.
To receive free commentary and analysis on the gold and silver markets, click here to be added to the Money Metals news service.
Author

Mike Maharrey
Money Metals Exchange
Mike Maharrey is a journalist and market analyst for MoneyMetals.com with over a decade of experience in precious metals. He holds a BS in accounting from the University of Kentucky and a BA in journalism from the University of South Florida.


