|

JPM Elliott Wave Bullish Structure

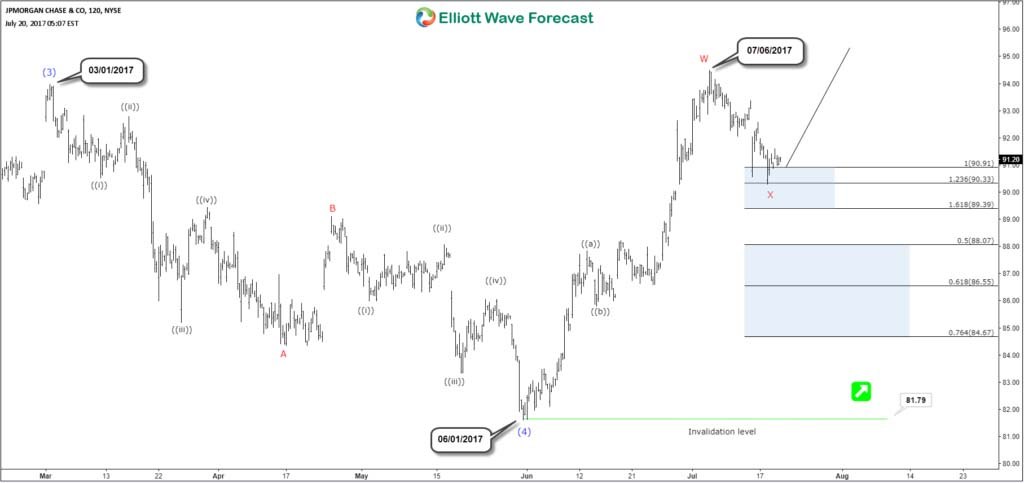
The Elliott Wave view for JPMorgan Chase (NYSE: JPM) suggests the rally from February 2016 low (52.5) to 03/01/2017 peak (93.98) have ended wave (3). The pullback from there unfolded as zigzag ABC structure which ended wave (4) at 06/01/2017 low (81.79). Up from there, the stock rallied in another zigzag structure before ending that short term cycle after reaching extreme on 07/06/2017 peak (94.51).

Therefore, JPM made new all time highs and it’s now showing 5 waves from 2016 low and still looking to reach the minimum target at $100.5. The stock can either rally from current levels as it already did 3 waves pullback and reached short term equal legs area 90.9 – 89.39, or the correction can still extend further toward the 50 – 76.4 Fibonacci retracement before finding buyers again to rally to new highs or bounce in 3 waves at least.

However if JPM fails to make new highs and the pivot at June low gives up, then the stock could be still in wave (4) doing an Irregular Flat correction which can take it toward 82-97 area before being able to resume the rally.

JPM 4H Chart 07/20/2017

ElliotWave

The market conditions have changed over time, so instruments can now be trending higher or lower in series of 3 wave sequences rather than impulsive sequence and this can be frequently seen in the forex market. No one is perfect and we don’t claim to have 100% accuracy, but a system with high accuracy acts as a great trading tool because forecasting is a process of continuous adjustments. A waver (trader) needs to accept when an idea doesn’t work out and adjust to new data.

Author

Elliott Wave Forecast Team

Elliott Wave Forecast Team

ElliottWave-Forecast.com

More from Elliott Wave Forecast Team
Share:

Editor's Picks

EUR/USD hits two-day highs near 1.1820

EUR/USD picks up pace and reaches two-day tops around 1.1820 at the end of the week. The pair’s move higher comes on the back of renewed weakness in the US Dollar amid growing talk that the Fed could deliver an interest rate cut as early as March. On the docket, the flash US Consumer Sentiment improves to 57.3 in February.

GBP/USD reclaims 1.3600 and above

GBP/USD reverses two straight days of losses, surpassing the key 1.3600 yardstick on Friday. Cable’s rebound comes as the Greenback slips away from two-week highs in response to some profit-taking mood and speculation of Fed rate cuts. In addition, hawkish comments from the BoE’s Pill are also collaborating with the quid’s improvement.

Gold climbs further, focus is back to 45,000

Gold regains upside traction and surpasses the $4,900 mark per troy ounce at the end of the week, shifting its attention to the critical $5,000 region. The move reflects a shift in risk sentiment, driving flows back towards traditional safe haven assets and supporting the yellow metal.

Crypto Today: Bitcoin, Ethereum, XRP rebound amid risk-off, $2.6 billion liquidation wave

Bitcoin edges up above $65,000 at the time of writing on Friday, as dust from the recent macro-triggered sell-off settles. The leading altcoin, Ethereum, hovers above $1,900, but resistance at $2,000 caps the upside. Meanwhile, Ripple has recorded the largest intraday jump among the three assets, up over 10% to $1.35.

Three scenarios for Japanese Yen ahead of snap election

The latest polls point to a dominant win for the ruling bloc at the upcoming Japanese snap election. The larger Sanae Takaichi’s mandate, the more investors fear faster implementation of tax cuts and spending plans. 

XRP rally extends as modest ETF inflows support recovery

Ripple is accelerating its recovery, trading above $1.36 at the time of writing on Friday, as investors adjust their positions following a turbulent week in the broader crypto market. The remittance token is up over 21% from its intraday low of $1.12.