Jobs Thursday?

USD: Sept '25 is Up at 96.465.
Energies: Aug '25 Crude is Down at 67.26.
Financials: The Sep '25 30 Year T-Bond is Higher by 14 ticks and trading at 115.04.
Indices: The Jun '25 S&P 500 emini ES contract is 2 ticks Higher and trading at 6275.50.
Gold: The Aug'25 Gold contract is trading Down at 3359.40.
Initial conclusion
This is not a correlated market. The USD is Up and Crude is Down which is normal, and the 30 Year T-Bond is trading Higher. The Financials should always correlate with the US dollar such that if the dollar is Higher, then the bonds should follow and vice-versa. The S&P is Higher and Crude is trading Down which is correlated. Gold is trading Lower which is correlated with the US dollar trading Up. I tend to believe that Gold has an inverse relationship with the US Dollar as when the US Dollar is down, Gold tends to rise in value and vice-versa. Think of it as a seesaw, when one is up the other should be down. I point this out to you to make you aware that when we don't have a correlated market, it means something is wrong. As traders you need to be aware of this and proceed with your eyes wide open. Asia traded Mixed. All of Europe is trading Mixed as well.
Possible challenges to Traders
-
Average Hourly Earnings m/m is out at 8:30 AM EST. This is Major.
-
Non-Farm Employment Change is out at 8:30 AM EST. This is Major.
-
Unemployment Rate is out at 8:30 AM EST. This is Major.
-
Unemployment Claims is out at 8:30 AM EST. This is Major.
-
Trade Balance is out at 8:30 AM EST. This is Major.
-
Final Services PMI is out at 9:45 AM EST. This is Major.
-
ISM Services PMI is out at 10 AM EST. This is Major.
-
Factory Orders m/m is out at 10 AM EST. This is Major.
-
Natural Gas Storage is out at 10:30 AM EST. This is Major.
-
FOMC Member Bostic Speaks at 11 AM EST. This is Major.
Traders, please note that we've changed the Bond instrument from the 10 Year (ZN) to the 2 Year (ZT). They work exactly the same.
We've elected to switch gears a bit and show correlation between the 2-year Treasury notes (ZT) and the S&P futures contract. The YM contract is the Dow Jones Industrial Average, and the purpose is to show reverse correlation between the two instruments. Remember it's likened to a seesaw, when up goes up the other should go down and vice versa.
Yesterday the ZT leaped Higher at around 8 AM EST with the ADP Non-Farm Employment numbers. The Dow dived Lower at the same time. Look at the charts below and you'll see a pattern for both assets. The Dow dived Lower at 8 AM EST and the ZT climbed Higher at around the same time. These charts represent the newest version of Bar Charts, and I've changed the timeframe to a 15-minute chart to display better. This represented a Long opportunity on the 2-year note, as a trader you could have netted about 30 plus ticks per contract on this trade. Each tick is worth $6.25. Please note: the front month for ZT is now Sep '25 and the Dow is now Sep '25. I've changed the format to filled Candlesticks (not hollow) such that it may be more apparent and visible.
Charts courtesy of BarCharts
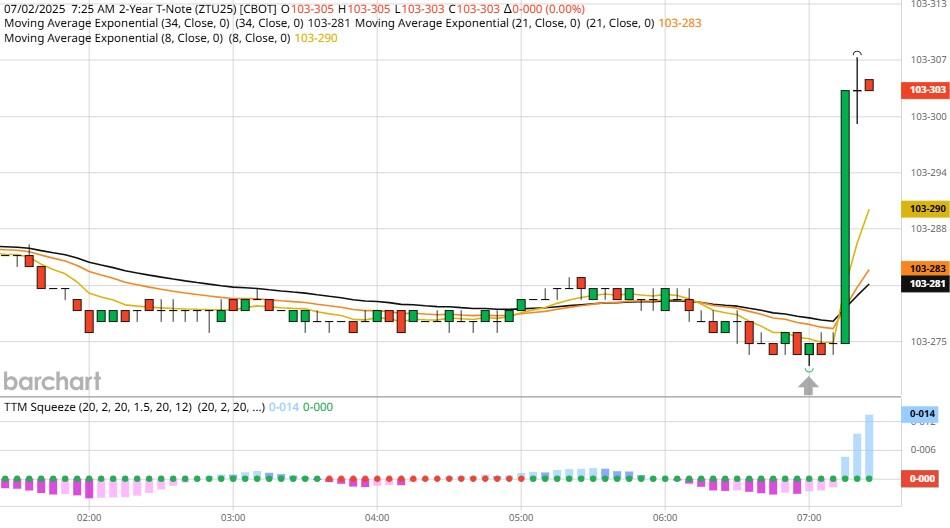
ZT -Sep 25 - 7/02/25
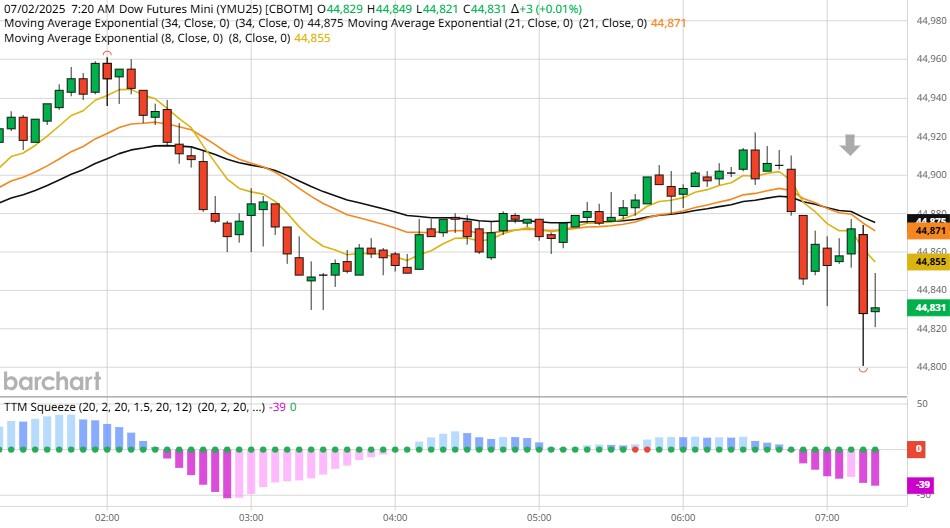
Dow - Sep 2025- 7/02/25
Bias
Yesterday we gave the markets a Mixed or Neutral bias and the indices didn't disappoint as the Dow traded 37 Lower but the other indices closed Higher. All in all, a Mixed or Neutral day. Today Non-Farm Payrolls will be reported as tomorrow is the Fourth of July and we hope everyone has a safe and pleasant holiday. This being said our bias is Mixed or Neutral.
Could this change? Of Course. Remember anything can happen in a volatile market.
Commentary
Today we have a Jobs Thursday which is highly unusual as it's ordinarily on a Friday but this year due to the July 4th holiday it will be done on Thursday. Yesterday the ADP job numbers came in short (the first time in more than two years) so we wonder what does the future hold? Perhaps the Federal Reserve will swing into action and start cutting rates? Time will tell. Want to learn Market Correlation and determine market direction hours before the Opening Bell?
Author

Nick Mastrandrea
Market Tea Leaves


