Good Morning Traders,

As of this writing 3:35 AM EST, here's what we see:

US Dollar: Dec. USD is Down at 93.780.
Energies: Jan '18 Crude is Down at 57.16.
Financials: The Mar 30 year bond is Up 8 ticks and trading at 153.04.
Indices: The Dec S&P 500 emini ES contract is 13 ticks Higher and trading at 2654.25.
Gold: The Feb gold contract is trading Up at 1251.50. Gold is 31 ticks Higher than its close.

Initial Conclusion

This is not a correlated market. The dollar is Down- and Crude is Down- which is not normal but the 30 year Bond is trading Higher. The Financials should always correlate with the US dollar such that if the dollar is lower then bonds should follow and vice-versa. The indices are Higher and Crude is trading Down- which is correlated. Gold is trading Up+ which is correlated with the US dollar trading Down-. I tend to believe that Gold has an inverse relationship with the US Dollar as when the US Dollar is down, Gold tends to rise in value and vice-versa. Think of it as a seesaw, when one is up the other should be down. I point this out to you to make you aware that when we don't have a correlated market, it means something is wrong. As traders you need to be aware of this and proceed with your eyes wide open.

At this hour all of Asia is trading Higher. As of this writing all of Europe is trading Higher.

Possible Challenges To Traders Today

  • JOLTS Job Openings is out at 10 AM EST. This is major.

  • 10-y Bond Auction starts at 1 PM EST. This is major.

Treasuries

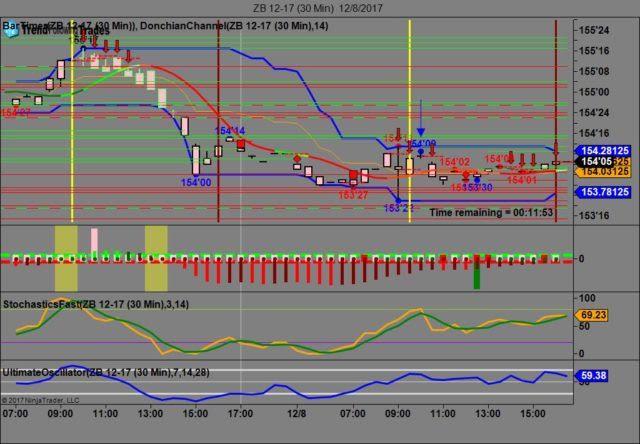
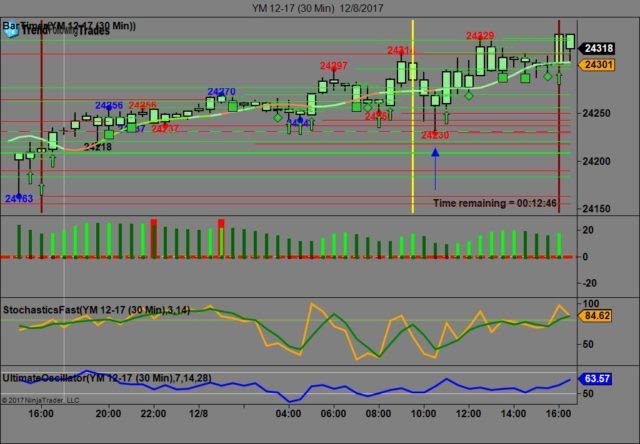
We've elected to switch gears a bit and show correlation between the 30 year bond (ZB) and The YM futures contract. The YM contract is the DJIA and the purpose is to show reverse correlation between the two instruments. Remember it's liken to a seesaw, when up goes up the other should go down and vice versa.

On Friday the ZB made it's move at around 10 AM EST. The ZB hit a High at around that time and the YM hit a Low. If you look at the charts below ZB gave a signal at around 10 AM EST and the YM was moving Higher at the same time. Look at the charts below and you'll see a pattern for both assets. ZB hit a High at around 10 AM and the YM hit a Low. These charts represent the newest version of Trend Following Trades and I've changed the timeframe to a 30 minute chart to display better. This represented a shorting opportunity on the 30 year bond, as a trader you could have netted about a dozen ticks per contract on this trade. Each tick is worth $31.25. We added a Donchian Channel to the charts to show the signals more clearly.

Charts Courtesy of Trend Following Trades built on a NinjaTrader platform

Pre-Market Global Review

Pre-Market Global Review

Bias

On Friday we gave the markets a Neutral bias as it was Jobs Friday and we always give a neutral bias on that day. The Dow gained over 100 points and the other indices gained ground as well. Today we aren't dealing with a correlated market and will maintain a neutral bias.

Could this change? Of Course. Remember anything can happen in a volatile market.

Commentary

We always maintain a neutral bias on Non Farm Payrolls as historically speaking the markets have never shown any sense of normalcy on that day. The US economy created 228,000 net new jobs versus the 198,000 expected. The unemployment rate remains at 4.1% which is the lowest in decades. Obviously this was all very good news for the markets and they rose dramatically. The Dow gained over 100 points to lodge another triple digit gain for the day and the other indices rose as well. The one fly in the ointment? Pays scales are not rising and the jobs being created aren't paying a living wage. Most people are forced to work two jobs and hope that they'll be able to get by raising a family. This is not just for those who don't possess a higher degree of education. They are plenty of college graduates who are working at Big Box retailers and some have two jobs.....

Trading performance displayed herein is hypothetical. The following Commodity Futures Trading Commission (CFTC) disclaimer should be noted.

Hypothetical performance results have many inherent limitations, some of which are described below. No representation is being made that any account will or is likely to achieve profits or losses similar to those shown.

In fact, there are frequently sharp differences between hypothetical performance results and the actual results subsequently achieved by any particular trading program. One of the limitations of hypothetical performance trading results is that they are generally prepared with the benefit of hindsight.

In addition, hypothetical trading does not involve financial risk, and no hypothetical trading record can completely account for the impact of financial risk in actual trading. For example, the ability to withstand losses or to adhere to a particular trading program in spite of trading losses are material points which can also adversely affect actual trading results.

There are numerous other factors related to the markets in general or to the implementation of any specific trading program which cannot be fully accounted for in the preparation of hypothetical performance results and all of which can adversely affect actual trading results.

Trading in the commodities markets involves substantial risk and YOU CAN LOSE A LOT OF MONEY, and thus is not appropriate for everyone. You should carefully consider your financial condition before trading in these markets, and only risk capital should be used.

In addition, these markets are often liquid, making it difficult to execute orders at desired prices. Also, during periods of extreme volatility, trading in these markets may be halted due to so-called “circuit breakers” put in place by the CME to alleviate such volatility. In the event of a trading halt, it may be difficult or impossible to exit a losing position.

Recommended Content


Recommended Content

Editors’ Picks

EUR/USD clings to gains near 1.0700, awaits key US data

EUR/USD clings to gains near 1.0700, awaits key US data

EUR/USD clings to gains near the 1.0700 level in early Europe on Thursday. Renewed US Dollar weakness offsets the risk-off market environment, supporting the pair ahead of the key US GDP and PCE inflation data. 

EUR/USD News

USD/JPY keeps pushing higher, eyes 156.00 ahead of US GDP data

USD/JPY keeps pushing higher, eyes 156.00 ahead of US GDP data

USD/JPY keeps breaking into its highest chart territory since June of 1990 early Thursday, recapturing 155.50 for the first time in 34 years as the Japanese Yen remains vulnerable, despite looming intervention risks. The focus shifts to Thursday's US GDP report and the BoJ decision on Friday. 

USD/JPY News

Gold closes below key $2,318 support, US GDP holds the key

Gold closes below key $2,318 support, US GDP holds the key

Gold price is breathing a sigh of relief early Thursday after testing offers near $2,315 once again. Broad risk-aversion seems to be helping Gold find a floor, as traders refrain from placing any fresh directional bets on the bright metal ahead of the preliminary reading of the US first-quarter GDP due later on Thursday.

Gold News

Injective price weakness persists despite over 5.9 million INJ tokens burned

Injective price weakness persists despite over 5.9 million INJ tokens burned

Injective price is trading with a bearish bias, stuck in the lower section of the market range. The bearish outlook abounds despite the network's deflationary efforts to pump the price. 

Read more

Meta takes a guidance slide amidst the battle between yields and earnings

Meta takes a guidance slide amidst the battle between yields and earnings

Meta's disappointing outlook cast doubt on whether the market's enthusiasm for artificial intelligence. Investors now brace for significant macroeconomic challenges ahead, particularly with the release of first-quarter gross domestic product (GDP) data on Thursday.

Read more

Majors

Cryptocurrencies

Signatures