Jobs Friday [Video]
![Jobs Friday [Video]](https://editorial.fxstreet.com/images/Macroeconomics/EconomicIndicator/Employment/job-in-the-employment-section-of-newspaper-19942906_XtraLarge.jpg)
US Dollar: Sep '22 USD is Up at 105.780.
Energies: Aug '22 Crude is Down at 88.45.
Financials: The Sep '22 30 Year bond is Down 6 ticks and trading at 143.16.
Indices: The Sep '22 S&P 500 Emini ES contract is 8 ticks Higher and trading at 4154.25.
Gold: The Dec'22 Gold contract is trading Down at 1802.60. Gold is 42 ticks Lower than its close.
Initial conclusion
This is not a correlated market. The dollar is Up, and Crude is Down which is normal, but the 30-year Bond is trading Lower. The Financials should always correlate with the US dollar such that if the dollar is lower, then the bonds should follow and vice-versa. The S&P is Higher, and Crude is trading Lower which is correlated. Gold is trading Lower which is correlated with the US dollar trading Up. I tend to believe that Gold has an inverse relationship with the US Dollar as when the US Dollar is down, Gold tends to rise in value and vice-versa. Think of it as a seesaw, when one is up the other should be down. I point this out to you to make you aware that when we don't have a correlated market, it means something is wrong. As traders you need to be aware of this and proceed with your eyes wide open. All of Asia is trading Higher. Currently all of Europe is trading Lower.
Possible challenges to traders today
-
Average Hourly Earnings is out at 8:30 AM EST. Major.
-
Non-Farm Employment Change is out at 8:30 AM EST. Major.
-
Unemployment Rate is out at 8:30 AM EST. Major.
-
Consumer Credit m/m is out at 3 PM EST. Major.
Treasuries
Traders, please note that we've changed the Bond instrument from the 30 year (ZB) to the 10 year (ZN). They work exactly the same.
We've elected to switch gears a bit and show correlation between the 10-year bond (ZN) and the S&P futures contract. The S&P contract is the Standard and Poor's, and the purpose is to show reverse correlation between the two instruments. Remember it's likened to a seesaw, when up goes up the other should go down and vice versa.
Yesterday the ZN made its move at around 10:30 AM EST. The ZN hit a Low at around that time and the S&P moved Lower shortly thereafter. If you look at the charts below ZN gave a signal at around 10:30 AM EST and the S&P moved Lower at around the same time. Look at the charts below and you'll see a pattern for both assets. ZN hit a Low at around 10:30 AM EST and the S&P was moving Lower shortly thereafter. These charts represent the newest version of MultiCharts and I've changed the timeframe to a 15-minute chart to display better. This represented a Long opportunity on the 10-year note, as a trader you could have netted about a dozen ticks per contract on this trade. Each tick is worth $15.625. Please note: the front month for the ZN is now Sep '22. The S&P contract is also Sep' 22 as well. The front months are now Sep' 22. I've changed the format to Heikin-Ashi such that it may be more apparent and visible.
Charts courtesy of MultiCharts built on an AMP platform
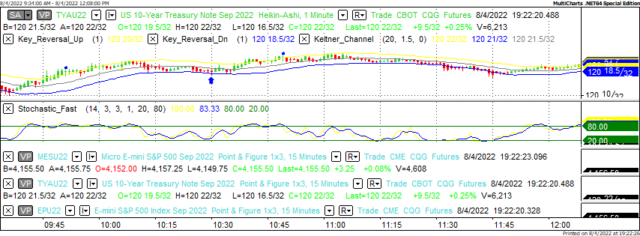
ZN - Sep 2022 - 08/04/22
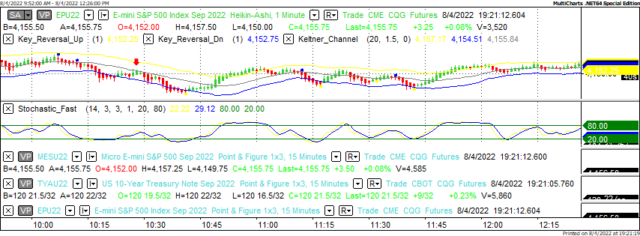
S&P - Sep 2022 - 08/04/22
Bias
Yesterday we gave the markets a Neutral or Mixed bias as we didn't see much ion the way of correlation Thursday morning. The Dow traded Lower by 86 points; the S&P dropped 3 but the Nasdaq gained 52 points. All in all a Neutral or Mixed Day. Given that today is Jobs Friday, our bias is Neutral.
Could this change? Of Course. Remember anything can happen in a volatile market.
Commentary
Yesterday we realized that we did not have a correlated market to deal with. The USD was Lower, but the Bonds were Higher, and this alone would suggest a non-correlated market. So we gave the markets a Neutral or Mixed bias and the markets didn't disappoint. Given that today is Non-Farm Payrolls or as we call it Jobs Friday, our bias is Neutral. Why? Because the markets have never shown any sense of normalcy on that day and most of what happens depends on the payroll report itself. Bottom line, the markets could go anywhere today, hence the Neutral or Mixed bias.
Author

Nick Mastrandrea
Market Tea Leaves


