Jobs Friday [Video]
![Jobs Friday [Video]](https://editorial.fxstreet.com/images/Macroeconomics/EconomicIndicator/Employment/NFP/us-job-hunter-8793311_XtraLarge.jpg)
US Dollar: Dec '21 USD is Up at 96.190.
Energies: Jan '22 Crude is Up at 68.11.
Financials: The Mar '22 30 Year bond is Up 12 ticks and trading at 162.22.
Indices: The Dec '21 S&P 500 emini ES contract is 51 ticks Lower and trading at 4561.75.
Gold: The Dec'21 Gold contract is trading Up at 1772.20. Gold is 95 ticks Higher than its close.
Initial conclusion
This is not a correlated market. The dollar is Up and Crude is Up which is not normal and the 30-year Bond is trading Higher. The Financials should always correlate with the US dollar such that if the dollar is lower then the bonds should follow and vice-versa. The S&P is Lower and Crude is trading Higher which is correlated. Gold is trading Higher which is not correlated with the US dollar trading up. I tend to believe that Gold has an inverse relationship with the US Dollar as when the US Dollar is down, Gold tends to rise in value and vice-versa. Think of it as a seesaw, when one is up the other should be down. I point this out to you to make you aware that when we don't have a correlated market, it means something is wrong. As traders, you need to be aware of this and proceed with your eyes wide open. Currently, Asia is trading Mixed. All of Europe is trading Mixed as well at this time.
Possible challenges to traders today
-
Average Hourly Earnings is out at 8:30 AM EST. This is Major.
-
Non-Farm Employment Change is out at 8:30 AM EST.Major.
-
Unemployment Rate is out at 8:30 AM EST.This is Major.
-
Final Services PMI is out at 9:45 AM EST.This is Major.
-
ISM Services PMI is out at 10 AM EST.This is Major.
-
Factory Orders are out at 10 AM EST.Major.
-
Treasury Currency Report. This is Major.
Treasuries
Traders, please note that we've changed the Bond instrument from the 30 year (ZB) to the 10 year (ZN). They work exactly the same.
We've elected to switch gears a bit and show correlation between the 10-year bond (ZN) and the S&P futures contract. The S&P contract is the Standard and Poor's, and the purpose is to show reverse correlation between the two instruments. Remember it's likened to a seesaw, when up goes up the other should go down and vice versa.
Yesterday the ZN made its move at around 9:30 AM EST. The ZN hit a High at around that time and the S&P moved Higher. If you look at the charts below ZN gave a signal at around 9:30 AM EST and the S&P moved Higher at around the same time. Look at the charts below and you'll see a pattern for both assets. ZN hit a High at around 9:30 AM EST and the S&P was moving Higher shortly thereafter. These charts represent the newest version of MultiCharts and I've changed the timeframe to a 15-minute chart to display better. This represented a Shorting opportunity on the 10-year note, as a trader you could have netted about 20 ticks per contract on this trade. Each tick is worth $15.625. Please note: the front month for the ZN is now Mar '22. The S&P contract is now Mar '22 as well. I've changed the format to Renko bars such that it may be more apparent and visible.
Charts Courtesy of MultiCharts built on an AMP platform
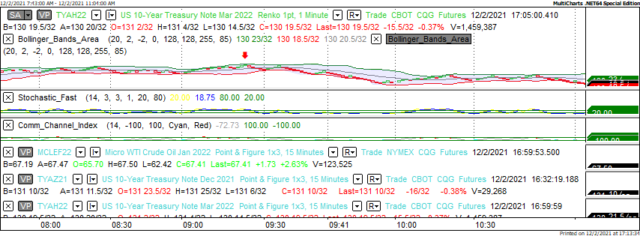
ZN - Mar 2022 - 12/02/21
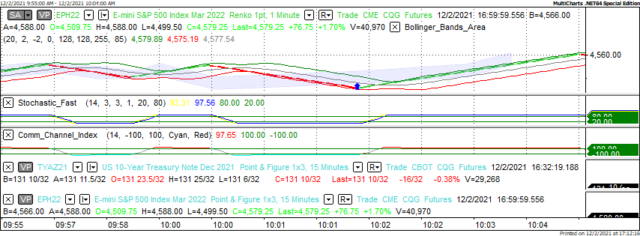
S&P - Mar 2022 - 12/02/21
Bias
Yesterday we gave the markets an Upside bias and the markets didn't disappoint. The Dow gained 618 points on the day and the other indices leaped forward as well. Given that today is Non-Farm Payrolls or as we call it Jobs Friday, we will maintain a Neutral or Mixed bias as is our custom. Why? Because the markets have never shown any sense of normalcy on this day.
Could this change? Of Course. Remember anything can happen in a volatile market.
Commentary
This has been a tough week as we all know. A week ago we find out about a new strain or variant of Covid 19. The Fed did not offer any positive news about tapering and now we understand that we might have a Debt Ceiling issue liken to what we saw in October and could face a government shutdown. Bottom line we need some good news this week and today we got in the Unemployment Claims report that showed claims of 222,000 versus the 238,000 expected. Today as is our custom we will maintain a Neutral or Mixed bias as it is Jobs Friday and the markets have never shown any sense of normalcy on this day.
Author

Nick Mastrandrea
Market Tea Leaves


