Jobs Friday [Video]
![Jobs Friday [Video]](https://editorial.fxstreet.com/images/Macroeconomics/EconomicIndicator/Employment/detail-of-newspaper-with-jobs-offer-9815226_XtraLarge.jpg)
US Dollar: Sept USD is Down at 98.015.
Energies: Sept '19 Crude is Up at 54.94.
Financials: The Sept 30 year bond is Up 25 ticks and trading at 158.15.
Indices: The Sept S&P 500 emini ES contract is 52 ticks Lower and trading at 2939.00.
Gold: The Dec Gold contract is trading Up at 1448.40. Gold is 160 ticks Higher than its close.
Initial Conclusion
This is not a correlated market. The dollar is Down- and Crude is Up+ which is normal but the 30 year Bond is trading Higher. The Financials should always correlate with the US dollar such that if the dollar is lower then bonds should follow and vice-versa. The S&P is Lower and Crude is trading Higher which is correlated. Gold is trading Higher which is correlated with the US dollar trading Down. I tend to believe that Gold has an inverse relationship with the US Dollar as when the US Dollar is down, Gold tends to rise in value and vice-versa. Think of it as a seesaw, when one is up the other should be down. I point this out to you to make you aware that when we don't have a correlated market, it means something is wrong. As traders you need to be aware of this and proceed with your eyes wide open.
Currently all of Asia is trading Down with the exception of the Indian Sensex exchange which is Higher. Currently Europe is trading Lower.
Possible Challenges To Traders Today
-
Average Hourly Earnings m/m is out at 8:30 AM EST. This is major
-
Non-Farm Employment Change is out at 8:30 AM EST. This is major.
-
Unemployment Rate out at 8:30 AM EST. This is major.
-
Trade Balance is out at 8:30 AM EST. This is major.
-
Revised UoM Consumer Sentiment is out at 10 AM EST. This is not major.
-
Revised UoM Inflation Expectations are out at 10 AM EST. This is not Major.
-
Factory Orders m/m are out at 10 AM EST. Major
Treasuries
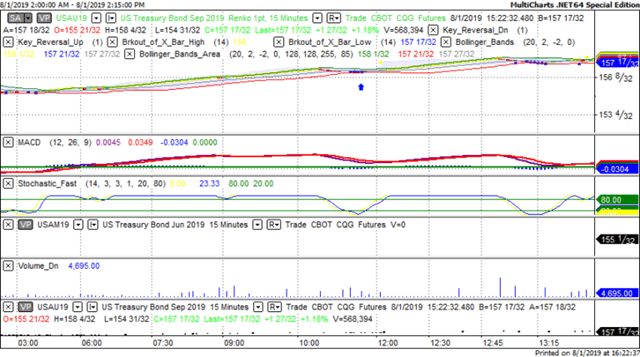
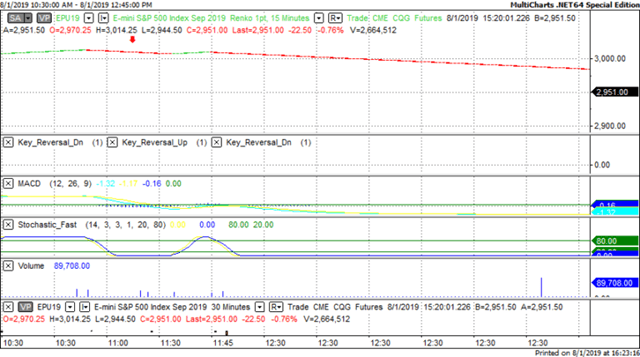
We've elected to switch gears a bit and show correlation between the 30 year bond (ZB) and The YM futures contract. The YM contract is the DJIA and the purpose is to show reverse correlation between the two instruments. Remember it's liken to a seesaw, when up goes up the other should go down and vice versa.
Yesterday the ZB made a major move at around 11 AM EST. The ZB hit a Low at around that time and the YM hit a High. If you look at the charts below ZB gave a signal at around 11 AM EST and the YM was moving Lower at the same time. Look at the charts below and you'll see a pattern for both assets. ZB hit a Low at around 11 AM and the YM was moving Lower at the same time. These charts represent the newest version of MultiCharts and I've changed the timeframe to a 15 minute chart to display better. This represented a Long opportunity on the 30 year bond, as a trader you could have netted about 30 plus ticks per contract on this trade. Each tick is worth $31.25. Please note: the front month for both the ZB and YM contract is now September, 2019 and I've changed the format to Renko bars such that it may be more apparent and visible.
Charts Courtesy of MultiCharts built on an AMP platform.
Bias
Yesterday we gave the markets a Neutral bias as we didn't see any evidence of correlation at all. The USD and the Bonds weren't trading in tandem with each other. The Dow dropped 281 points and the other indices lost ground as well. Given that today is Non Farm Payrolls aka Jobs Friday, we will maintain a Neutral bias.
Could this change? Of Course. Remember anything can happen in a volatile market.
Commentary
Yesterday we gave the markets a Neutral bias as we didn't see any evidence of market correlation yesterday morning. Now a Neutral bias means the markets could go in any direction (either up or down) but we've never seen the situation where the markets went in both directions on the same day. The fluctuations were quite dramatic as in the morning the markets advanced by hundreds of points. But after 1:30 PM EST that changed and the markets went south and closed 281 points Lower. Are we surprised? No, as we state every day anything can happen in a volatile market.
Author

Nick Mastrandrea
Market Tea Leaves


