Jobs Friday

US Dollar: Dec. USD is Up at 93.950.
Energies: Jan ’18 Crude is Up at 56.81.
Financials: The Mar 30 year bond is unchanged and trading at 152.28.
Indices: The Dec S&P 500 emini ES contract is 14 ticks Higher and trading at 2643.00.
Gold: The Feb gold contract is trading Down at 1249.10. Gold is 41 ticks Lower than its close.
Initial Conclusion
This is not a correlated market. The dollar is Up+ and Crude is Up+ which is not normal and the 30 year Bond is unchanged. The Financials should always correlate with the US dollar such that if the dollar is lower then bonds should follow and vice-versa. The indices are Higher and Crude is trading Up+ which is not correlated. Gold is trading Down- which is correlated with the US dollar trading Up+. I tend to believe that Gold has an inverse relationship with the US Dollar as when the US Dollar is down, Gold tends to rise in value and vice-versa. Think of it as a seesaw, when one is up the other should be down. I point this out to you to make you aware that when we don’t have a correlated market, it means something is wrong. As traders you need to be aware of this and proceed with your eyes wide open.
At this hour all of Asia is trading Higher. As of this writing all of Europe is trading Higher.
Possible Challenges To Traders Today
-
Average Hourly Earnings is out at 8:30 AM. This is major.
-
Non-Farm Employment Change is out at 8:30 AM. This is major.
-
Unemployment Rate is out at 8:30 AM EST. This is major.
-
Final Wholesale Inventories is out at 10 AM EST. This is major.
-
Prelim UoM Consumer Sentiment is out at 10 AM. Major.
-
Prelim UoM Inflation Expectations is out at 10 AM. Major.
Treasuries
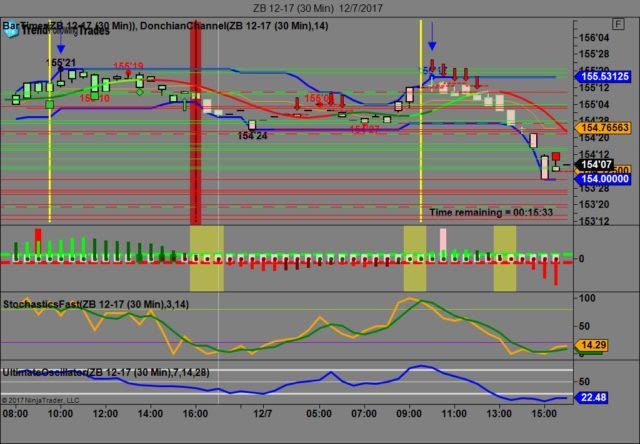
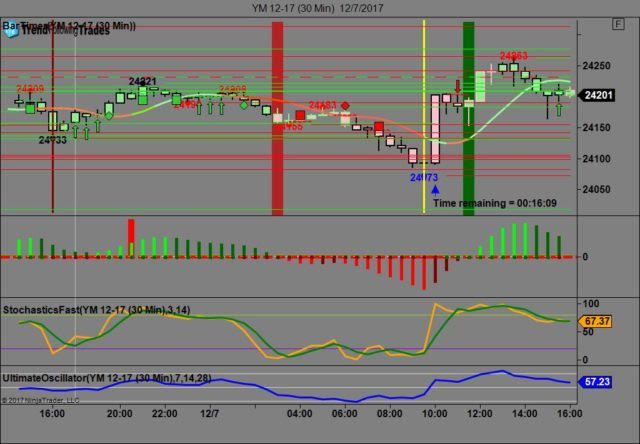
We’ve elected to switch gears a bit and show correlation between the 30 year bond (ZB) and The YM futures contract. The YM contract is the DJIA and the purpose is to show reverse correlation between the two instruments. Remember it’s liken to a seesaw, when up goes up the other should go down and vice versa.
Yesterday the ZB made it’s move at around 10 AM EST. The ZB hit a High at around that time and the YM hit a Low. If you look at the charts below ZB gave a signal at around 10 AM EST and the YM was moving Higher at the same time. Look at the charts below and you’ll see a pattern for both assets. ZB hit a High at around 10 AM and the YM hit a Low. These charts represent the newest version of Trend Following Trades and I’ve changed the timeframe to a 30 minute chart to display better. This represented a shorting opportunity on the 30 year bond, as a trader you could have netted about 30 plus ticks per contract on this trade. Each tick is worth $31.25. We added a Donchian Channel to the charts to show the signals more clearly.
Charts Courtesy of Trend Following Trades built on a NinjaTrader platform.
Bias
Yesterday we gave the markets an Upside bias as the Bonds and Gold were both trading Lower yesterday morning and this usually signifies an Upside Day. The markets didn’t disappoint as the Dow gained 71 points and the other indices gained ground as well. Given that today is Jobs Friday our bias is Neutral.
Could this change? Of Course. Remember anything can happen in a volatile market.
Commentary
Yesterday all we did was to follow our rules on market correlation which told us as early as 4 AM EST that the markets were poised to go higher and they did. Today is Non Farm Payrolls which is the major report of the month and as such we will maintain a Neutral bias. Why? Because historically speaking the markets have never shown any sense of urgency on this day.
Author

Nick Mastrandrea
Market Tea Leaves


