Jobs Friday

Good Morning Traders,
As of this writing 4:10 AM EST, here’s what we see:
US Dollar: Mar. USD is Up at 101.595.
Energies: February Crude is Up at 53.79.
Financials: The Mar 30 year bond is Up 1 tick and trading at 152.17.
Indices: The March S&P 500 emini ES contract is 6 ticks Lower and trading at 2262.75.
Gold: The February gold contract is trading Down at 1176.60. Gold is 47 ticks Lower than its close.
Initial Conclusion
This is not a correlated market. The dollar is Up+ and crude is Up+ which is not normal and the 30 year bond is trading Up+. The Financials should always correlate with the US dollar such that if the dollar is lower then bonds should follow and vice-versa. The indices are Down- and Crude is trading Up+ which is correlated. Gold is trading Down which is correlated with the US dollar trading Up. I tend to believe that Gold has an inverse relationship with the US Dollar as when the US Dollar is down, Gold tends to rise in value and vice-versa. Think of it as a seesaw, when one is up the other should be down. I point this out to you to make you aware that when we don’t have a correlated market, it means something is wrong. As traders you need to be aware of this and proceed with your eyes wide open.
Asia traded mainly lower with the exception of the Singapore and Hang Seng exchanges which traded higher. As of this writing Europe is trading mixed with half the exchanges higher and the other half lower.
Possible Challenges To Traders Today
– Average Hourly Earnings is out at 8:30 AM EST. This is major.
– Non-Farm Employment Change is out at 8:30 AM. This is major.
– Unemployment Rate is out at 8:30 AM EST. This is major.
– Trade Balance is out at 8:30 AM EST. This is not major.
– Factory Orders m/m is out at 10 AM EST. This is major.
– FOMC Member Evans Speaks at 12:15 PM EST. This is major.
Treasuries
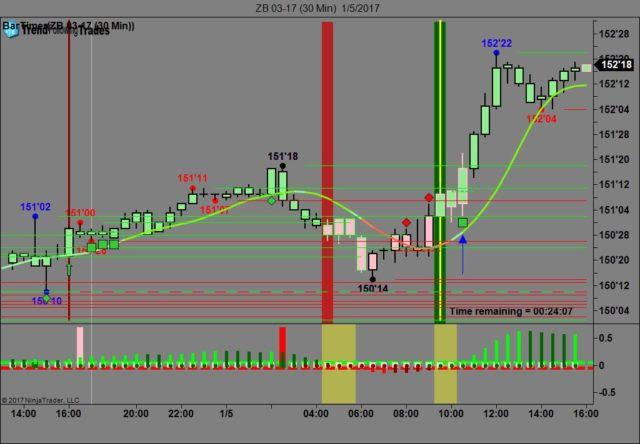
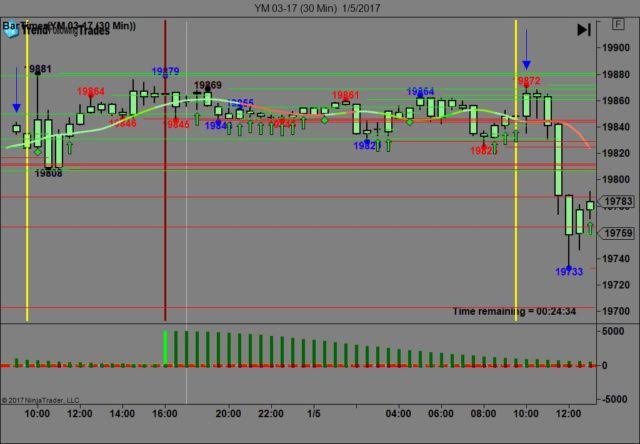
We’ve elected to switch gears a bit and show correlation between the 30 year bond (ZB) and The YM futures contract. The YM contract is the DJIA and the purpose is to show reverse correlation between the two instruments. Remember it’s liken to a seesaw, when up goes up the other should go down and vice versa.
Yesterday the ZB made its move at around 10 AM EST with the bulk of the economic news reported. The ZB hit a low at around that time and the YM hit a high. If you look at the charts below ZB gave a signal at around 10 AM EST and the YM was moving lower at the same time. Look at the charts below and you’ll see a pattern for both assets. ZB hit a low at around 10 AM EST and the YM hit a high. These charts represent the newest version of Trend Following Trades and I’ve changed the timeframe to a 30 minute chart to display better. This represented a long opportunity on the 30 year bond, as a trader you could have netted about 30 plus ticks per contract on this trade. Each tick is worth $31.25. We added a Donchian Channel to the charts to show the signals more clearly.
Charts Courtesy of Trend Following Trades built on a NinjaTrader platform.
Bias
Yesterday we gave the markets a downside bias as the Bonds and Gold were both trading higher and this is indicative of a downside move. The markets didn’t disappoint as the Dow dropped 43 points, the S&P lost 2 but the Nasdaq gained 11. Given that today is Jobs Friday, our bias is neutral.
Could this change? Of Course. Remember anything can happen in a volatile market.
Commentary
Well today marks the 1st Non-Farm Payroll report for 2017 and if you think it’s important you bet it is. This will set the tone for the year ahead but can also serve to signal if the Fed will raise later this month. It will also signal what the new Presidential Administration will be all about as Mr. Trump takes office in two weeks and I would venture to say he can’t wait. Well Mr. Trump we can’t either as we’re curious as to what your tenure will be all about. We know you value capital but we’re interested in knowing how you will accomplish all that you said during the campaign, but I guess as in all things, time will tell….
Author

Nick Mastrandrea
Market Tea Leaves


