Jobs Friday

Good Morning Traders,
As of this writing 4:30 AM EST, here’s what we see:
US Dollar: Dec. USD is Down at 100.945.
Energies: January Crude is Down at 50.94.
Financials: The Dec 30 year bond is Up 11 ticks and trading at 151.07.
Indices: The December S&P 500 emini ES contract is 30 ticks Lower and trading at 2184.50.
Gold: The December gold contract is trading Up at 1175.30. Gold is 84 ticks Higher than its close.
Initial Conclusion
This is not a correlated market. The dollar is Down- and crude is Down- which is not normal but the 30 year bond is trading Up. The Financials should always correlate with the US dollar such that if the dollar is lower then bonds should follow and vice-versa. The indices are Down and Crude is trading Down which is not correlated. Gold is trading Up which is correlated with the US dollar trading Down. I tend to believe that Gold has an inverse relationship with the US Dollar as when the US Dollar is down, Gold tends to rise in value and vice-versa. Think of it as a seesaw, when one is up the other should be down. I point this out to you to make you aware that when we don’t have a correlated market, it means something is wrong. As traders you need to be aware of this and proceed with your eyes wide open.
All of Asia traded Lower and currently all of Europe (as of this writing) is trading Lower.
Possible Challenges To Traders Today
– Average Hourly Earnings is out at 8:30 AM EST. This is major.
– Non-Farm Employment Change is out at 8:30 AM. This is major.
– Unemployment Rate is out at 8:30 AM EST. This is major.
– FOMC Member Brainard Speaks at 8:45 AM EST. This is major.
– FOMC Member Tarullo Speaks at 1 PM EST. This is major
Treasuries
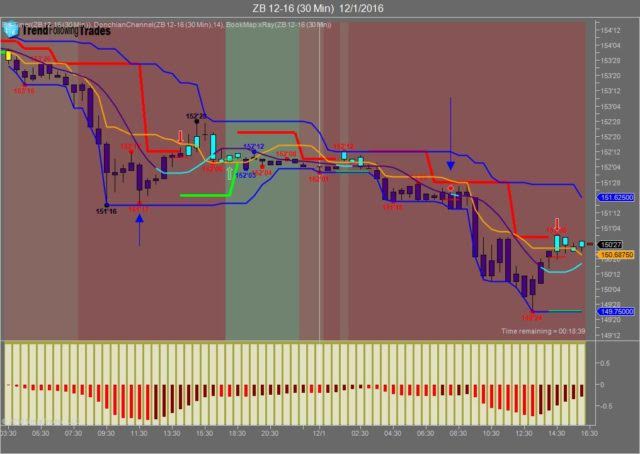
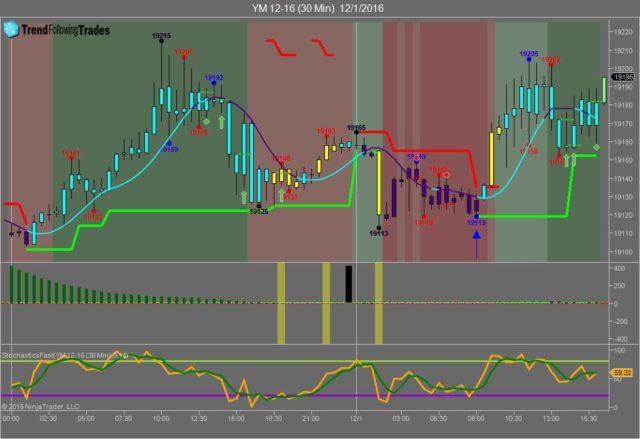
We’ve elected to switch gears a bit and show correlation between the 30 year bond (ZB) and The YM futures contract. The YM contract is the DJIA and the purpose is to show reverse correlation between the two instruments. Remember it’s liken to a seesaw, when up goes up the other should go down and vice versa.
Yesterday the ZB made it’s move at around 8 AM EST prior to Unemployment Claims being reported. The ZB hit a high at around that time and the YM hit a low. If you look at the charts below ZB gave a signal at around 8 AM EST and the YM was moving higher at the same time. Look at the charts below and you’ll see a pattern for both assets. ZB hit a high at around 8 AM EST and the YM hit a low. These charts represent the newest version of Trend Following Trades and I’ve changed the timeframe to a 30 minute chart to display better. This represented a shorting opportunity on the 30 year bond, as a trader you could have netted about 30 plus ticks per contract on this trade. Each tick is worth $31.25. We added a Donchian Channel to the charts to show the signals more clearly.
Charts Courtesy of Trend Following Trades built on a NinjaTrader platform
Bias
Yesterday we gave the markets a neutral bias as the USD, Bonds and Gold were all trading down and the S&P was also in negative territory yesterday morning; hence our bias was neutral which means the markets could go in any direction. The Dow gained 68 points yesterday however the Nasdaq and S&P both fell. Given that today is Jobs Friday, we will maintain our neutral bias
Could this change? Of Course. Remember anything can happen in a volatile market.
Commentary
So this is the first Non-Farm Payroll report after the election and prior to an FOMC Meeting. So do we think it’s important? You’d better believe it. We have two Fed members speaking today: one at 8:45 AM EST (immediately after the numbers are reported) and at 1 PM EST. What they say may give some clues as to the Fed’s future intention. Our future President seems intent on hiking rates but he needs to be careful on what he wishes as it may come true. A billionaire wants a rate hike so that the interest they collect from various accounts and instruments increases. That’s ok for passive investments but a rate hike also means higher interest rates on debt as well which is not good for consumer spending. Gee I thought a billionaire would know that but I guess that’s a benefit of living in a bubble, you get an alternate sense of reality.
Author

Nick Mastrandrea
Market Tea Leaves


