Job numbers move markets

USD: Dec '23 is Up at 104.045.
Energies: Jan '24 Crude is Down at 70.50.
Financials: The Mar '24 30 Year T-Bond is Down 8 ticks and trading at 118.24.
Indices: The Dec '23 S&P 500 emini ES contract is 25 ticks Lower and trading at 4602.00.
Gold: The Dec'23 Gold contract is trading Down at 2009.90.
Initial conclusion
This is not a correlated market. The USD is Up and Crude is Down which is not normal, and the 30 Year T-Bond is trading Lower. The Financials should always correlate with the US dollar such that if the dollar is Higher, then the bonds should follow and vice-versa. The S&P is Higher and Crude is trading Higher which is not correlated. Gold is trading Lower which is correlated with the US dollar trading Up. I tend to believe that Gold has an inverse relationship with the US Dollar as when the US Dollar is down, Gold tends to rise in value and vice-versa. Think of it as a seesaw, when one is up the other should be down. I point this out to you to make you aware that when we don't have a correlated market, it means something is wrong. As traders you need to be aware of this and proceed with your eyes wide open. Asia is trading Mixed with half the exchanges Higher and other half Lower. Currently Europe is trading mainly Lower with the exception of the Paris exchange which is Higher.
Possible challenges to traders
-
10 Year Bond Auction starts at 1 PM EST. This is Major.
-
Lack of Major economic news.
Treasuries
Traders, please note that we've changed the Bond instrument from the 30 year (ZB) to the 10 year (ZN). They work exactly the same.
We've elected to switch gears a bit and show correlation between the 10-year bond (ZN) and the S&P futures contract. The S&P contract is the Standard and Poor's, and the purpose is to show reverse correlation between the two instruments. Remember it's likened to a seesaw, when up goes up the other should go down and vice versa. Today we aren't dealing with a correlated market and our bias is to the Upside.
On Friday the ZN migrated Higher at around 8:30 AM EST( immediately after the job numbers were reported) as the S&P hit a High at around the same time. If you look at the charts below the S&P gave a signal at around 8:30 AM and the ZN started its Upward trend. Look at the charts below and you'll see a pattern for both assets. S&P hit a High at around 8:30 AM and migrated Lower. These charts represent the newest version of MultiCharts and I've changed the timeframe to a 15-minute chart to display better. This represented a Long opportunity on the 10-year note, as a trader you could have netted about 25 plus ticks per contract on this trade. Each tick is worth $15.625. Please note: the front month for the ZN is now Mar '24. The S&P contract is still Dec' 23. I've changed the format to filled Candlesticks (not hollow) such that it may be more apparent and visible.
Charts courtesy of MultiCharts built on an AMP platform
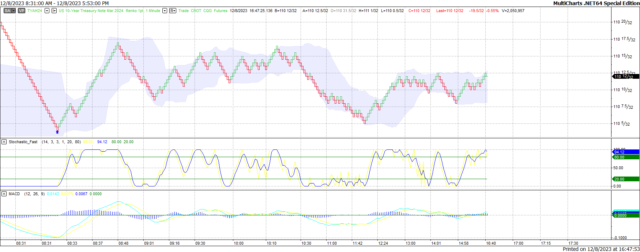
ZN - Mar 2024 - 12/08/23
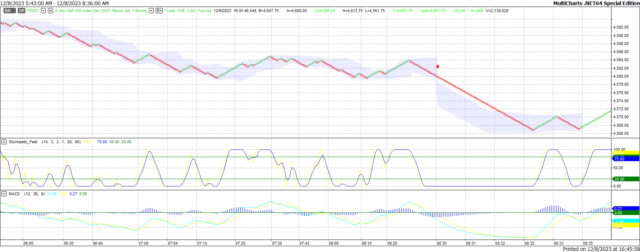
S&P - Dec 2023 - 12/08/23
Bias
On Friday we gave the markets a Neutral bias as it was Jobs Friday, and we always maintain a Neutral bias on that day. Why? Because the markets have never shown any sense of normalcy. The Dow closed 130 points Higher, and the other indices gained ground as well. Today we aren't dealing with a correlated market and our bias is Neutral.
Could this change? Of Course. Remember anything can happen in a volatile market.
Commentary
Friday morning came and it seemed as though the markets were waiting for the shoe to fall as I think everyone expected a sour number. But it didn't exactly work out that way as the US economy created 199,000 net new jobs versus an expectation of 184,000. The Bonds which were dropping did an about face as the mindset seemed to be "the Fed won't reduce interest rates now with that number." They could be right but personally I think the Fed will hold pat on rates this week as they know the more, they raise the more difficult it will become for consumers to make major purchases (cars, homes,etc.) The housing market clearly needs interest rates to drop as buying a home is becoming more and more difficult and real estate is a major contributor to the economy.
Author

Nick Mastrandrea
Market Tea Leaves


