Job Numbers “Jolts” Markets [Video]
![Job Numbers “Jolts” Markets [Video]](https://editorial.fxstreet.com/images/Markets/Currencies/coins-of-different-currencies-29548070_XtraLarge.jpg)
Good Morning Traders,
As of this writing 4:35 AM EST, here's what we see:
US Dollar: March USD is Down at 95.875.
Energies: April '19 Crude is Down at 58.49.
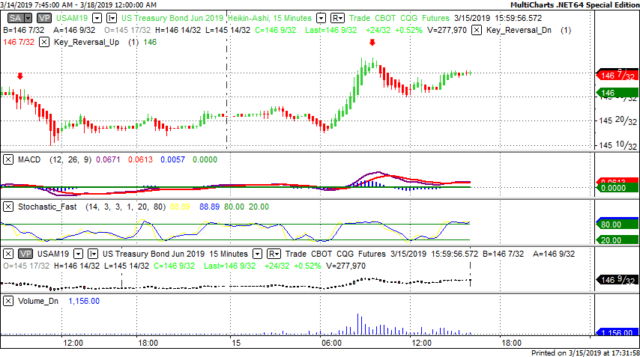
Financials: The Jun 30 year bond is Down 1 tick and trading at 146.05.
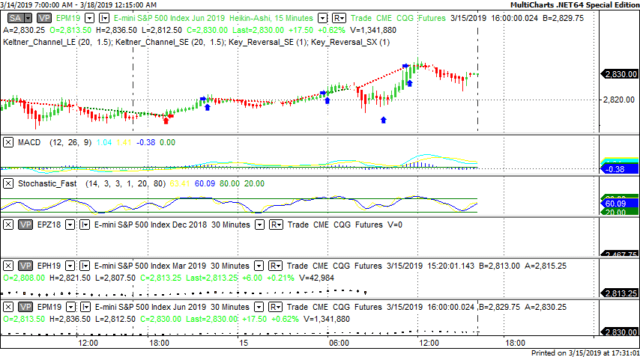
Indices: The Mar S&P 500 emini ES contract is 6 ticks Higher and trading at 2831.50.
Gold: The April Gold contract is trading Up at 1303.40 Gold is 5 ticks Higher than its close.
Initial Conclusion
This is not a correlated market. The dollar is Down- and Crude is Down- which is not normal and the 30 year Bond is trading Lower. The Financials should always correlate with the US dollar such that if the dollar is lower then bonds should follow and vice-versa. The S&P is Higher and Crude is trading Lower which is correlated. Gold is trading Higher which is correlated with the US dollar trading Lower. I tend to believe that Gold has an inverse relationship with the US Dollar as when the US Dollar is down, Gold tends to rise in value and vice-versa. Think of it as a seesaw, when one is up the other should be down. I point this out to you to make you aware that when we don't have a correlated market, it means something is wrong. As traders you need to be aware of this and proceed with your eyes wide open.
At this hour all of Asia is trading Higher. Currently all of Europe is trading to the Upside as well.
Possible Challenges To Traders Today
-
NAHB Housing Market Index is out at 10 AM EST. This is major.
-
Lack of other major economic news.
Treasuries
We've elected to switch gears a bit and show correlation between the 30 year bond (ZB) and The YM futures contract. The YM contract is the DJIA and the purpose is to show reverse correlation between the two instruments. Remember it's liken to a seesaw, when up goes up the other should go down and vice versa.
On Friday the ZB made a major move at around 9:30 AM EST. The ZB hit a High at around that time and the YM hit a Low. If you look at the charts below ZB gave a signal at around 9:30 AM EST and the YM was moving Higher at the same time. Look at the charts below and you'll see a pattern for both assets. ZB hit a High at around 9:30 AM and the YM was moving Higher at the same time. These charts represent the newest version of MultiCharts and I've changed the timeframe to a 15 minute chart to display better. This represented a Shorting opportunity on the 30 year bond, as a trader you could have netted about 15 plus ticks per contract on this trade. Each tick is worth $31.25. Please note: the front month for the ZB contract is now June, 2019
Charts Courtesy of MultiCharts built on an AMP platform
Bias
On Friday we gave the markets a Neutral bias as the futures didn't have any sense of direction at all on Friday morning. The Dow gained 139 points and the other indices gained ground as well. Today we aren't dealing with a correlated market and our bias is to the Upside.
Could this change? Of Course. Remember anything can happen in a volatile market.
Commentary
Friday looked as though it was going to be another lackluster session in the markets as this past week has proven. However that changed after 10 AM EST when the Jolts Job Opening numbers were released. The number came in at 7.58 versus 7.27 expected and 7.48 last month. So in essence this number beat out both the expectation for this month as well as the actual from last month. This is quite impressive and one that the market took note of.
Author

Nick Mastrandrea
Market Tea Leaves


