US Dollar: Dec USD is Up at 98.610.

Energies: Nov '19 Crude is Up at 53.14.

Financials: The Dec 30 year bond is Down 5 ticks and trading at 164.25.

Indices: The Dec S&P 500 emini ES contract is 45 ticks Lower and trading at 2936.00.

Gold: The Dec Gold contract is trading Down at 1507.30.   Gold is 56 ticks Lower than its close.


Initial Conclusion

This is not a correlated market.  The dollar is Up+ and Crude is Up+ which is not normal but the 30 year Bond is trading Lower.  The Financials should always correlate with the US dollar such that if the dollar is lower then bonds should follow and vice-versa. The S&P is Lower and Crude is trading Higher which is correlated. Gold is trading Lower which is correlated with the US dollar trading Up.   I tend to believe that Gold has an inverse relationship with the US Dollar as when the US Dollar is down, Gold tends to rise in value and vice-versa. Think of it as a seesaw, when one is up the other should be down. I point this out to you to make you aware that when we don't have a correlated market, it means something is wrong. As traders you need to be aware of this and proceed with your eyes wide open.

At this time Asia is trading Mixed with half the exchanges Higher and the other half Lower.  Currently all of Europe is trading Lower.  


Possible Challenges To Traders Today

  • Consumer Credit is out at 3 PM EST.  This is major.

  • Lack of major economic news.


Treasuries

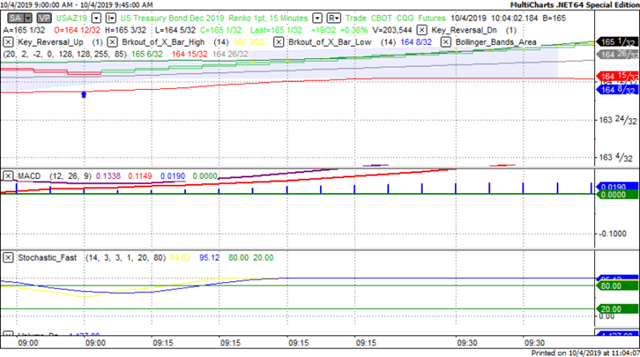
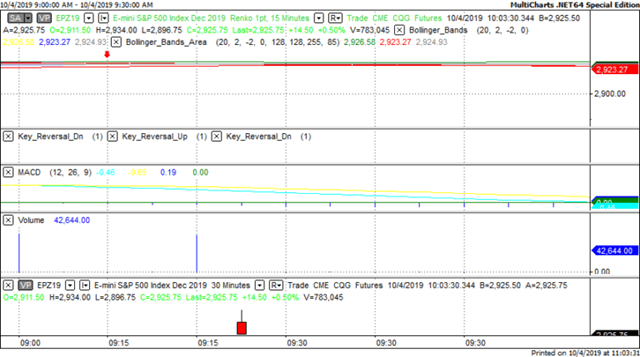
We've elected to switch gears a bit and show correlation between the 30 year bond (ZB) and The YM futures contract.  The YM contract is the DJIA and the purpose is to show reverse correlation between the two instruments.  Remember it's liken to a seesaw, when up goes up the other should go down and vice versa.

On Friday the ZB made a major move at around 9 AM EST.  The ZB hit a Low at around that time and the S&P hit a High.  If you look at the charts below ZB gave a signal at around 9 AM EST and the S&P was moving Lower at the same time. Look at the charts below and you'll see a pattern for both assets. ZB hit a Low at around 9 AM and the S&P was moving Lower at the same time.  These charts represent the newest version of MultiCharts and I've changed the timeframe to a 15 minute chart to display better.  This represented a Shorting opportunity on the 30 year bond, as a trader you could have netted about 20 plus ticks per contract on this trade.  Each tick is worth $31.25.  Please note: the front month for the ZB is now December.  The S&P contract is now at December as well and I've changed the format to Renko bars such that it may be more apparent and visible.


Charts Courtesy of MultiCharts built on an AMP platform

ZB


YM

Bias

On Friday we gave the markets a Neutral bias as it was Jobs Friday and we always maintain a Neutral bias on that day.  Why?  Because the markets have never shown any sense of normalcy on that day.  The Dow gained 373 points and the other indices gained ground as well.  Today we aren't dealing with a correlated market and our bias is Neutral.

Could this change? Of Course. Remember anything can happen in a volatile market. 


Commentary

So the markets expected a gain of 145,000 net new jobs created in September but the number came in at 136,000 or 9k short of expectation.  Yet the markets gained ground on Friday.  Why?  The unemployment rate fell to a 50 year low coming in at 3.5%.  No doubt this administration will take full credit for this and will use it for anti impeachment rhetoric.  Be that as it may the market is enjoying as traders feel this was enough of an incentive for the Fed to keep rates low. 

Trading performance displayed herein is hypothetical. The following Commodity Futures Trading Commission (CFTC) disclaimer should be noted.

Hypothetical performance results have many inherent limitations, some of which are described below. No representation is being made that any account will or is likely to achieve profits or losses similar to those shown.

In fact, there are frequently sharp differences between hypothetical performance results and the actual results subsequently achieved by any particular trading program. One of the limitations of hypothetical performance trading results is that they are generally prepared with the benefit of hindsight.

In addition, hypothetical trading does not involve financial risk, and no hypothetical trading record can completely account for the impact of financial risk in actual trading. For example, the ability to withstand losses or to adhere to a particular trading program in spite of trading losses are material points which can also adversely affect actual trading results.

There are numerous other factors related to the markets in general or to the implementation of any specific trading program which cannot be fully accounted for in the preparation of hypothetical performance results and all of which can adversely affect actual trading results.

Trading in the commodities markets involves substantial risk and YOU CAN LOSE A LOT OF MONEY, and thus is not appropriate for everyone. You should carefully consider your financial condition before trading in these markets, and only risk capital should be used.

In addition, these markets are often liquid, making it difficult to execute orders at desired prices. Also, during periods of extreme volatility, trading in these markets may be halted due to so-called “circuit breakers” put in place by the CME to alleviate such volatility. In the event of a trading halt, it may be difficult or impossible to exit a losing position.

Recommended Content


Recommended Content

Editors’ Picks

EUR/USD clings to daily gains above 1.0650

EUR/USD clings to daily gains above 1.0650

EUR/USD gained traction and turned positive on the day above 1.0650. The improvement seen in risk mood following the earlier flight to safety weighs on the US Dollar ahead of the weekend and helps the pair push higher.

EUR/USD News

GBP/USD recovers toward 1.2450 after UK Retail Sales data

GBP/USD recovers toward 1.2450 after UK Retail Sales data

GBP/USD reversed its direction and advanced to the 1.2450 area after touching a fresh multi-month low below 1.2400 in the Asian session. The positive shift seen in risk mood on easing fears over a deepening Iran-Israel conflict supports the pair.

GBP/USD News

Gold holds steady at around $2,380 following earlier spike

Gold holds steady at around $2,380 following earlier spike

Gold stabilized near $2,380 after spiking above $2,400 with the immediate reaction to reports of Israel striking Iran. Meanwhile, the pullback seen in the US Treasury bond yields helps XAU/USD hold its ground.

Gold News

Bitcoin Weekly Forecast: BTC post-halving rally could be partially priced in Premium

Bitcoin Weekly Forecast: BTC post-halving rally could be partially priced in

Bitcoin price shows no signs of directional bias while it holds above  $60,000. The fourth BTC halving is partially priced in, according to Deutsche Bank’s research. 

Read more

Week ahead – US GDP and BoJ decision on top of next week’s agenda

Week ahead – US GDP and BoJ decision on top of next week’s agenda

US GDP, core PCE and PMIs the next tests for the Dollar. Investors await BoJ for guidance about next rate hike. EU and UK PMIs, as well as Australian CPIs also on tap.

Read more

Majors

Cryptocurrencies

Signatures