|

Japan’s Nikkei 225 falls below 28660

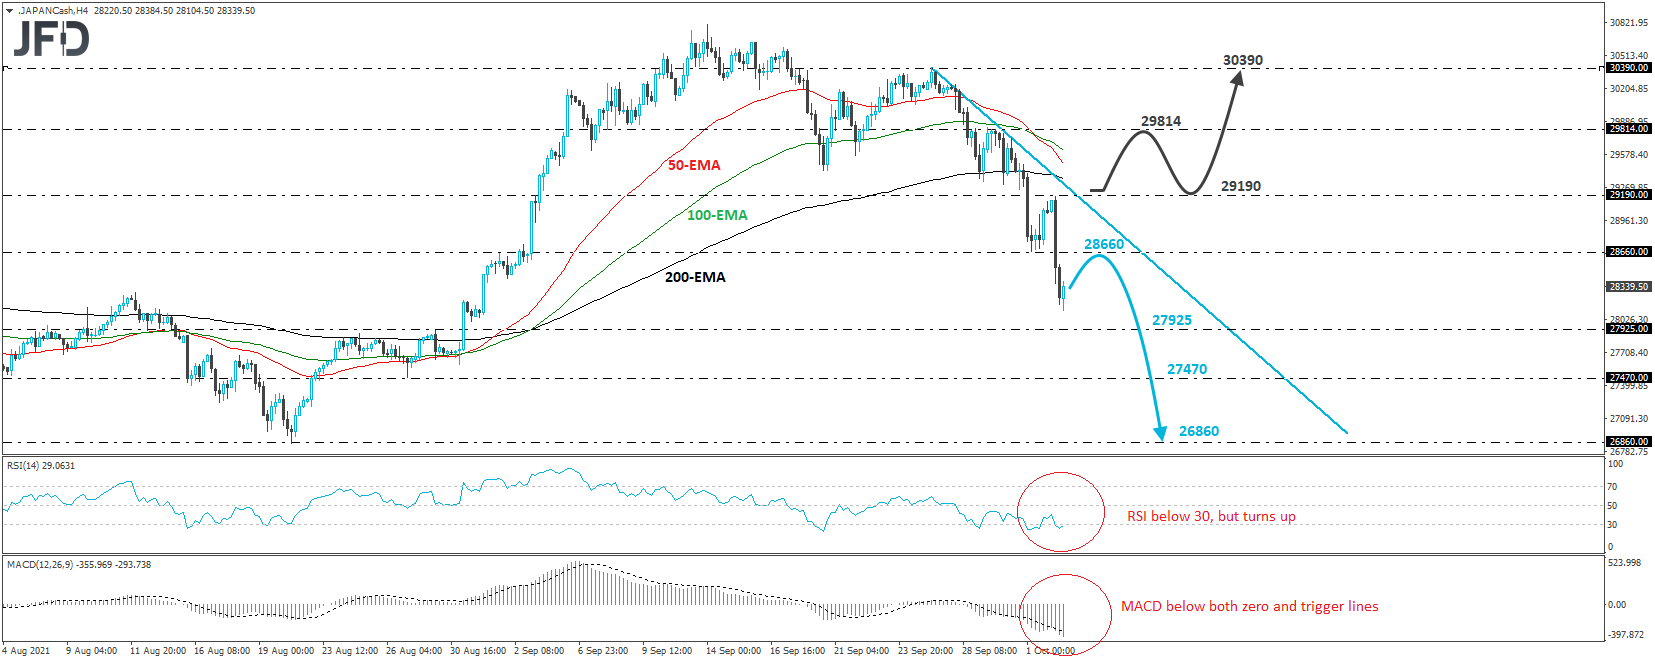
The Japanese Nikkei 225 cash index fell sharply on Monday, breaking below the 28660 barrier, marked by the low of October 1st, thereby confirming a forthcoming lower low. The price continues to print lower lows and lower highs below the downside resistance line drawn from the high of September 27th, and thus, we will consider the short-term outlook to be negative for now.

We see some signs that a small rebound may be looming, but as long as the price stays below the downside line, we would treat that as a corrective bounce. The bears may take charge from near the 28660 zone and push the action down to the 27925 barrier, marked by the inside swing high of August 30th. If they don’t stop there, we could see them aiming for the low of August 27th, at 27470, the break of which could extend the fall towards the low of August 20th, at 26860.

Shifting attention to our short-term oscillators, we see that the RSI lies below 30, and that the MACD runs below both its zero and trigger lines. Both indicators detect strong downside speed and support the notion for further declines. However, the RSI has just turned up, adding to our cautiousness over a small corrective bounce before the next leg south.

In order to abandon the bearish case, we would like to see a recovery above 29190. This will not only confirm the break above the downside resistance line, but it will also confirm a forthcoming higher high. The bulls may then climb towards the peak of September 29th, at 29814, where another break may carry more extensions, perhaps towards the peak of September 27th, at 30390.
Japan

Author

More from JFD Team
Share:

Editor's Picks

GBP/USD clings to 1.3500 amid marginal losses

GBP/USD alternates gains with losses around the 1.3500 neighbourhood on Tuesday. Indeed, Cable struggles to further extend its incipient recovery in a context of continuous instability in the Middle East and modest gains in the Greenback.

EUR/USD alternates gains with losses near 1.1540

EUR/USD navigates a tight range near 1.1550 in the latter part of Tuesday’s NA session. The US Dollar’s vacillating price action accompanies the pair while market participants gear up for the crucial US inflation data due on Wednesday.

Gold loses the grip below $4,400

Gold retreats from its earlier tops and briefly revisited the $4,350 region per troy ounce on Tuesday. The yellow metal’s modest retracement follows lacklustre gains in the US Dollar and declining US Treasury yields across the curve, all amid steady uncertainty from the geopolitical landscape.

Shiba Inu Price Forecast: SHIB extends sell-off despite surging futures Open Interest
Shiba Inu (SHIB) maintains a bearish outlook on Tuesday, as it edges lower at $0.00000450. This marks the seventh day the meme coin has sustained a sell-off, weighed down by a weak technical structure. Shiba Inu derivatives continue to gain momentum, with perpetual futures Open Interest (OI) rising to 11.08 trillion SHIB on Tuesday, from 10.46 trillion the day before.
The inflation narrative is still way more important than the employment story
Core bonds sold off yesterday with the belly of the curve slightly underperforming in the US while European curves showed more of a bear flattening. Daily changes on the US curve varied between +4.7 bps (2-yr) and +6.4 bps (7-yr).
9-3: Is the Federal Reserve’s vote tally Warsh's new forward guidance?
The rate did not move. Neither did the statement, and that’s the more interesting fact. Set the July 29 Federal Open Market Committee (FOMC) statement beside the one issued on June 17, and the two documents are identical apart from a single verb and a paragraph at the bottom naming three dissenters.















