It's time to get Serious About Silver

The World Silver Survey 2019 Review, the institute’s annual World Silver Survey said that global silver demand hit a three-year high in 2018, surpassing more than one billion ounces, an increase of 4% from 2017.
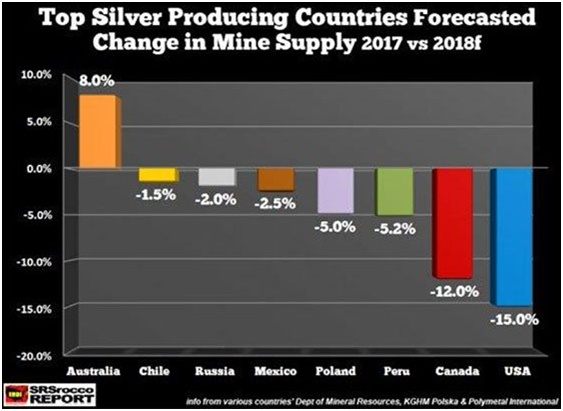
At the same time, global silver mine production fell for the third straight year, dropping 2% in 2018 to 855.7 million ounces.
The top 10 silver producing countries are: Peru, Bolivia, Australia, Argentina, Mexico, Chile, Poland, China, Russia and Guatemala.
And get this... in every one of these countries, silver production has been falling for the last 4 consecutive years!
-
Supply from scrap sources is at a 20-year low.
-
Silver fabrication (manufacturing) demand is just below record levels.
-
Silver demand for solar panels has risen for six consecutive years - and is expected to set a new record in 2019
In comparison to the roughly 6 billion ounces of gold mined over history, roughly 54 billion ounces of silver are estimated to have been mined over time. In direct contrast to gold, however, roughly half of the mined silver (27.2 billion ounces) is estimated to have been consumed, destroyed or discarded. (Incrementum AG)
Subtracting from the remaining mined-total roughly 24 billion ounces of silver estimated to exist in the form of jewelry, silverware, statues and decorative objects, this leaves only 2.8 billion ounces in the existing, investable above-ground stock of silver, valued at only $46.2 billion.
Therefore, the investable stock of silver measures less than 2% of the (size of the) investable stock of gold. It is easy to appreciate why silver performance during precious metal advances can prove comparatively explosive! [emphasis added] (Maria Smirnova, Sprott Asset Management.)
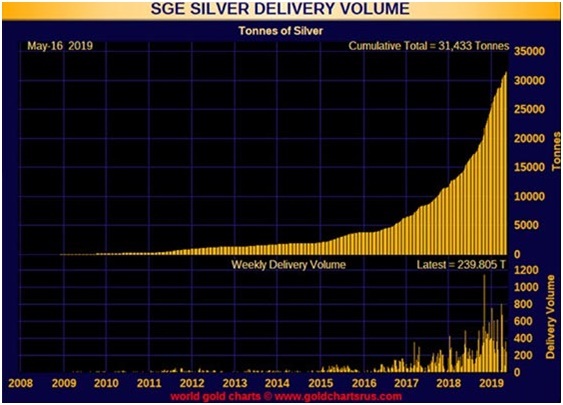
Silver consumption by China (and India) shows no signs of abating.
The movement of gold from West to East (with over 60% transiting through Swiss refineries as it is turned into the most-in-demand form, .9999 fine) is like a virtual golden river.
While demand is picking up in some European countries, North America appears to be asleep, with many people actually selling their gold and silver into the most recent upside breakout. How much sense does that make?
Eight years of declining prices have caused many investors to develop a case of "continuation bias."
They understandably assume that this downward trend – which at its low point had shaved off fully 60% of silver's 2011 price point highs – will continue.
But...we emphatically believe they are incorrect!
About the evolving situation, David Morgan at The MorganReport says the following:
"Silver will shine, then soar, and finally skyrocket, while stupefying the masses! Remember, only two-tenths of a percent of the world's wealth is actually in silver. If that were to become just a measly one percent, it would require a 50-fold increase. So when all other assets are failing miserably do you really think that only one percent of the world's population would want to own this timeless monetary metal?
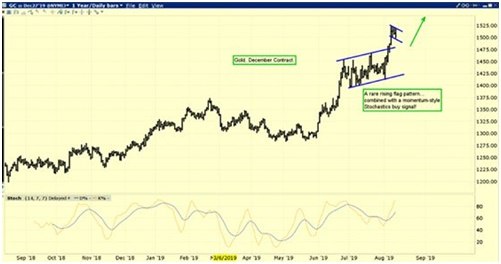
Charts courtesy Graceland Updates
The above gold and silver charts have formed the most unusual technical patterns I have ever run across.
The gold chart shows an upward-sloping flag pattern, which is usually bearish – yet prices broke to the upside and then began forming another bull flag.
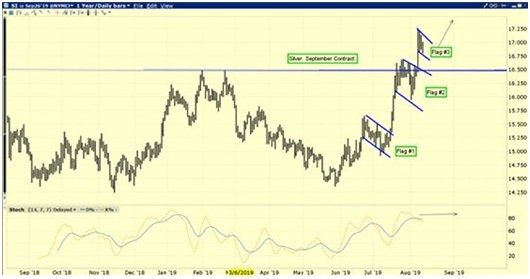
Silver is even more interesting.
Over the last few weeks prices have formed three stair-stepping bull flags. Whether this is a precursor to higher prices right now or we see a "correction" that contradicts them, it tells me that this is no ordinary rally. Not just a few months of upside action and then giving it all back like in 2016. Something much more significant is going on...
I fully believe that what we're seeing in gold, silver and the mining shares is the beginning of what may evolve into the greatest metals' bull market in which you and I have ever participated.
In the early 2000's, I stated my belief that, before the public-mania phase had been completed a number of years hence, we would see silver prices at between $175 and $250 the ounce.
This may sound hard to believe.
However, we now have a gold metric figure to which this kind of prediction can be attached. A number of analysts have stated their belief that gold will reach as high as $40,000 or more an ounce.
Anything is possible, but I tend to be quite a bit more conservative. Using Jim Rickards projection of $10,000 an ounce – who I believe was the first one to state it, I then suggest a gold/silver ratio which might help define several price points under such a scenario.
Just a few weeks ago, the gold/silver ratio was 94:1, At this writing it's still in the upper 80's.
In 1980, the ratio got down to about 15:1. But I am going to be much more "conservative." I suggest three ratio points that, assuming $10,000 gold, could helps us assign a silver price expectation when these two metals start topping out.
-
At 60:1, silver would trade at about $165 the ounce.
-
At 50:1, silver would trade at about $200 the ounce.
-
At 40:1, silver would trade at about $250 the ounce.
-
Below that – whip out your calculator and have some fun!
If the metals get anywhere near these levels, I will be implementing the plan David Morgan and I discuss in great detail in our book, Second Chance: How to Make - and Keep - Big Money from the Coming Gold and Silver Shock-Wave.
A lot of books talk about how to make a lot of money from such a big move, but our text may be the only one devoting serious thought – and devising a method according with, not against human nature – to a plan for how you should be able to actually hold onto most of it!
If our thinking resonates with you even a little bit, you owe it to yourself (and your family?) to get to work on a plan that makes sense for your situation and temperament and then execute it.
Start laying in some physical gold and silver. There is compelling evidence that as the price reaches about $26, a major resistance point from years' past, "the public" – your friends and neighbors – will finally decide to join the crowd.
With such a relatively small market you can be certain, assuming availability, both the price and the premiums will be much higher than they are today. So what's the point of waiting?
To receive free commentary and analysis on the gold and silver markets, click here to be added to the Money Metals news service.
Author

David Smith
Money Metals Exchange


