Italy Says No, Markets Say Yes

Good Morning Traders,
As of this writing 4 AM EST, here’s what we see:
US Dollar: Dec. USD is Down at 100.065.
Energies: January Crude is Down at 51.16.
Financials: The Dec 30 year bond is Up 4 ticks and trading at 150.28.
Indices: The December S&P 500 emini ES contract is 9 ticks Lower and trading at 2202.00.
Gold: The December gold contract is trading Down at 1174.40. Gold is 21 ticks Lower than its close.
Initial Conclusion
This is not a correlated market. The dollar is Down- and crude is Down- which is not normal but the 30 year bond is trading Up. The Financials should always correlate with the US dollar such that if the dollar is lower then bonds should follow and vice-versa. The indices are Down and Crude is trading Down which is not correlated. Gold is trading Down which is not correlated with the US dollar trading Down. I tend to believe that Gold has an inverse relationship with the US Dollar as when the US Dollar is down, Gold tends to rise in value and vice-versa. Think of it as a seesaw, when one is up the other should be down. I point this out to you to make you aware that when we don’t have a correlated market, it means something is wrong. As traders you need to be aware of this and proceed with your eyes wide open.
Asia traded mainly Higher with the exception of the Shanghai exchange which traded Lower. As of this writing Europe is trading mixed with half the exchanges trading Higher and the other half Lower.
Possible Challenges To Traders Today
– Revised Nonfarm Productivity is out at 8:30 AM. This is major.
– Trade Balance is out at 8:30 AM EST. This is not major.
– Revised Unit Labor Costs is out at 10 AM EST. This is major.
– Factory Orders m/m is out at 10 AM EST. This is major.
– IBD/TIPP Economic Optimism is out at 10 AM EST. This is major.
Treasuries
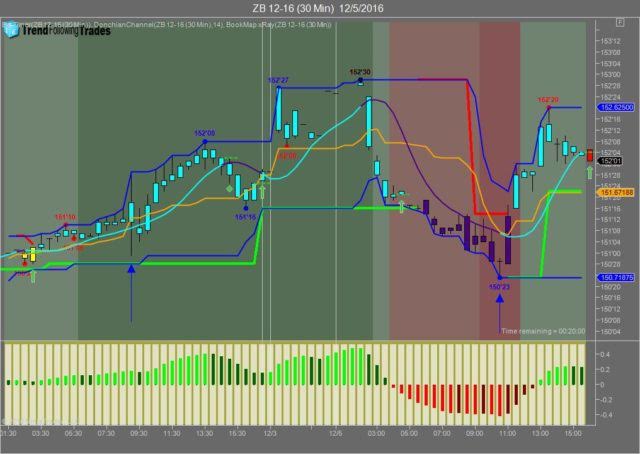
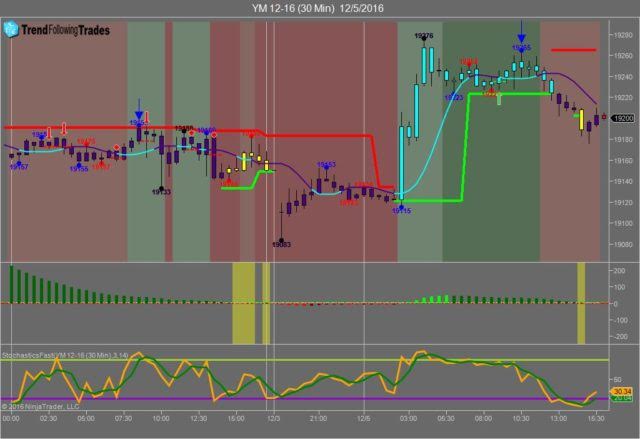
We’ve elected to switch gears a bit and show correlation between the 30 year bond (ZB) and The YM futures contract. The YM contract is the DJIA and the purpose is to show reverse correlation between the two instruments. Remember it’s liken to a seesaw, when up goes up the other should go down and vice versa.
Yesterday the ZB made it’s move at around 10:30 AM EST with no real economic news in sight. The ZB hit a low at around that time and the YM hit a high. If you look at the charts below ZB gave a signal at around 10:30 AM EST and the YM was moving lower at the same time. Look at the charts below and you’ll see a pattern for both assets. ZB hit a low at around 10:30 AM EST and the YM hit a high. These charts represent the newest version of Trend Following Trades and I’ve changed the timeframe to a 30 minute chart to display better. This represented a long opportunity on the 30 year bond, as a trader you could have netted about 30 plus ticks per contract on this trade. Each tick is worth $31.25. We added a Donchian Channel to the charts to show the signals more clearly.
Charts Courtesy of Trend Following Trades built on a NinjaTrader platform
Bias
Yesterday we gave the markets an upside bias and the markets didn’t disappoint as the Dow rose 46 points and the other indices gained ground as well. Yesterday morning both the Bonds and Gold were both trading lower and this is indicative of an upside move. Today we aren’t dealing with a correlated market and our bias is neutral.
Could this change? Of Course. Remember anything can happen in a volatile market.
Commentary
So this past Sunday the Italian people voted not to streamline law making abilities in their country and their Prime Minister decided to resign at some point in 2017. I guess it’s better than a dictatorship which what they had at one point. I can say this with the utmost certainty as my grandfather and father both left Italy because they weren’t too wowed with Fascism. Whereas Italy said no the rest of the world said yes as both Europe and the US both traded higher. The holdout was Asia but that was because the Asian markets were opened immediately after the Italian election was concluded. Today we have Factory Orders which are major and a proven market mover.
Author

Nick Mastrandrea
Market Tea Leaves


