It begins [Video]
![It begins [Video]](https://editorial.fxstreet.com/images/Markets/Currencies/Majors/DollarIndex/100-bills-background-1855591_XtraLarge.jpg)
US Dollar: Sept '21 USD is Down at 92.455.
Energies: Oct '21 Crude is Up at 71.42.
Financials: The Dec '21 30 Year bond is Up 4 ticks and trading at 164.14.
Indices: The Sept '21 S&P 500 emini ES contract is 44 ticks Higher and trading at 4445.75.
Gold: The Dec'21 Gold contract is trading Down at 1803.60. Gold is 35 ticks Lower than its close.
Initial conclusion
This is a not a correlated market. The dollar is Down and Crude is Up which is normal but the 30 year Bond is trading Higher. The Financials should always correlate with the US dollar such that if the dollar is lower then bonds should follow and vice-versa. The S&P is Higher and Crude is trading Higher which is not correlated. Gold is trading Lower which is not correlated with the US dollar trading Down. I tend to believe that Gold has an inverse relationship with the US Dollar as when the US Dollar is down, Gold tends to rise in value and vice-versa. Think of it as a seesaw, when one is up the other should be down. I point this out to you to make you aware that when we don't have a correlated market, it means something is wrong. As traders you need to be aware of this and proceed with your eyes wide open. All of Asia is trading Lower with the exception of the Indian Sensex exchange which is Higher. All of Europe is also trading Lower with the exception of the London exchange which is trading Higher at this time.
Possible challenges to traders today
-
Empire State Mfg Index is out at 8:30 AM EST This is Major.
-
Import Prices m/m is out at 8:30 AM EST. This is Major
-
Industrial Production is out at 9:15 AM EST. This is Major.
-
Capacity Utilization Rate is out at 9:15 AM EST. Major.
-
Crude Oil Inventories is out at 10:30 AM EST. This is Major.
Treasuries
Traders please note that we've changed the Bond instrument from the 30 year (ZB) to the 10 year (ZN). They work exactly the same.
We've elected to switch gears a bit and show correlation between the 10 year bond (ZN) and The S&P futures contract. The S&P contract is the Standard and Poor's and the purpose is to show reverse correlation between the two instruments. Remember it's liken to a seesaw, when up goes up the other should go down and vice versa.
Yesterday the ZN made it's move at around 10 AM EST. The ZN hit a Low at around that time and the S&P moved Lower. If you look at the charts below ZN gave a signal at around 10 AM EST and the S&P moved Lower at around the same time. Look at the charts below and you'll see a pattern for both assets. ZN hit a Low at around 10 AM EST and the S&P was moving Lower shortly thereafter. These charts represent the newest version of MultiCharts and I've changed the timeframe to a 15 minute chart to display better. This represented a Long opportunity on the 10 year note, as a trader you could have netted about a dozen ticks per contract on this trade. Each tick is worth $15.625. Please note: the front month for the ZN is now Dec '21. The S&P contract remains Sept '21 for the time being. I've changed the format to Renko bars such that it may be more apparent and visible.
Charts courtesy of MultiCharts built on an AMP platform
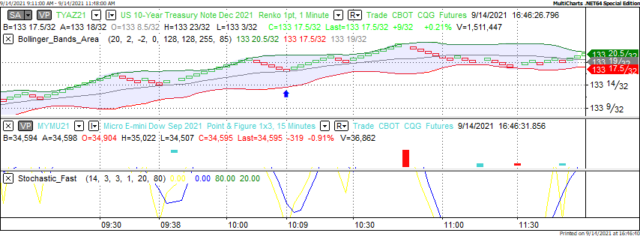
ZN - Dec 2021 - 9/14/21
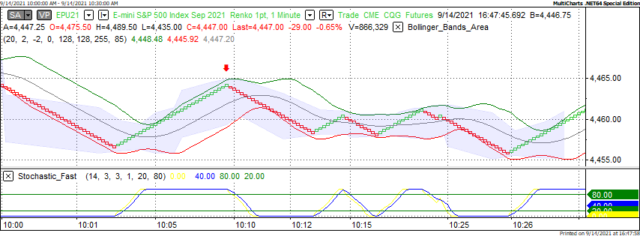
S&P - Sept 2021 - 9/14/21
Bias
Yesterday we gave the markets an Upside bias as the indices were correlated in that direction. However the markets had other ideas as the Dow dropped 292 points and the other indices lost ground as well. Today we aren't dealing with a correlated market and our bias is to the Upside.
Could this change? Of Course. Remember anything can happen in a volatile market
Commentary
So what happened? Yesterday morning the markets were correlated to the Upside but we didn't see follow thru on the indices. So what happened? At 10 AM EST a Congressional Hearing began to cross examine Secretary of State Antony Blinken and from what I saw of it it was more of a barbeque with Mr. Blinken being the main course. The GOP members on that committee hammered him relentlessly on the mishaps of the Afghan withdrawal; completely ignoring the fact that the previous administration had negotiated this deal. Want proof? Look at any chart of the DJIA yesterday. After 10 AM the Dow never reached positive territory.
Author

Nick Mastrandrea
Market Tea Leaves


