Is This Short S&P ETF About To Rally?
With the down turn in the S&P on February 21st, 2019. on the exact date forecast by my ZD36 energy field forecast, one wonders. "Is this turn is for real?" "How can I capitalize on it if it is real?"
While trading S&P futures is one way to capitalize on this turn, the high leverage and fast moves make it more risky than many individual traders can afford. An alternative is to use an inverse Exchange Traded Fund, such as the Proshares SH Short S&P 500 fund.
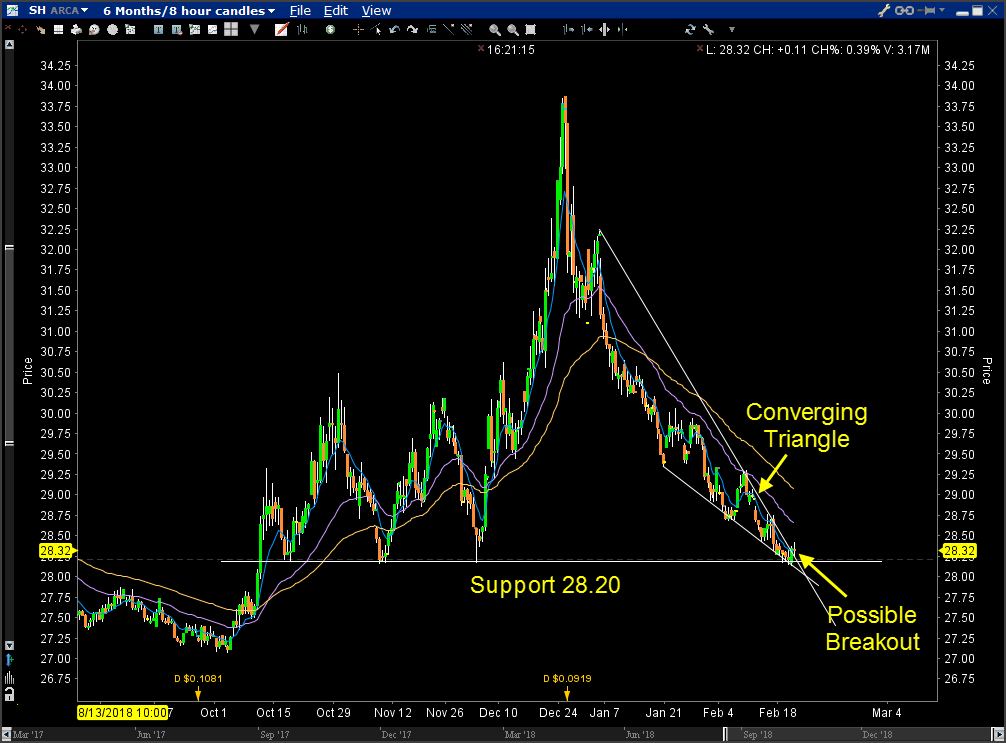
This 8 hour six month SH chart has an interesting pattern right now, as shown here. During the Fall 2018 decline in the S&P, SH rallied sharply, until the Christmas top. Since then,it has declined, forming a very clear converging triangle. Buying breakouts of descending converging triangles is one of the best technical setups.
SH may be breaking out from that triangle now. If this is a valid breakout, a trader may wish to try a long position. What makes this attractive is how little risk is involved. SH has very clear support at $28.20. A safe stop on a long position could be placed at $28.10. Assuming a rally to a price of 30, and a buy at $28.40 a loss limit of $.40/share could be established, for a potential gain of $1.60/share. This is a quiet reasonable risk/reward ratio of 4:1. Of course, traders should wait for a confirmation of a breakout before going long.
What I like about ETF's is that beginners can use just a few contracts while learning to trade. Also. ETF's can be traded over days, weeks, and months, avoiding the frantic pressures of trying to complete with the Flash Boy's computers.
As always, I make no recommendation as to what your do. I'm simply pointing out a possible opportunity. If you want to learn more about trading, check out my courses at Moneytide.com/Institute
This content was published on Dr. Al Larson's Chaos Clinic which you can attend each Friday for free.
Dr. Al Larson has developed a complete Chaos Model of Markets, four unique courses that let you become a Certified Chaos Trader, some very unique eMylar fractal pattern overlays, and tools that permit forecasting individual stocks and markets years in advance. You can also sign up for a free weekly email, and attend a free Chaos Clinic on Fridays. To learn more, click on the author's profile.
Be sure to sign up for the free weekly email!
Author

Dr. Al Larson, PhD
MoneyTide.com
Dr. Al Larson holds a Ph.D. in Electrical and Computer Engineering from the University of Wisconsin. He is a 1964 Distinguished Graduate of the U. S. Air Force Academy.


