Is Silver overbought?

Is silver overbought?
Technically, yes. But that doesn’t mean the bull market is over, as some mainstream analysts would have you believe.
From a technical standpoint, an asset is overbought when the price runs up extremely fast relative to the recent trend.
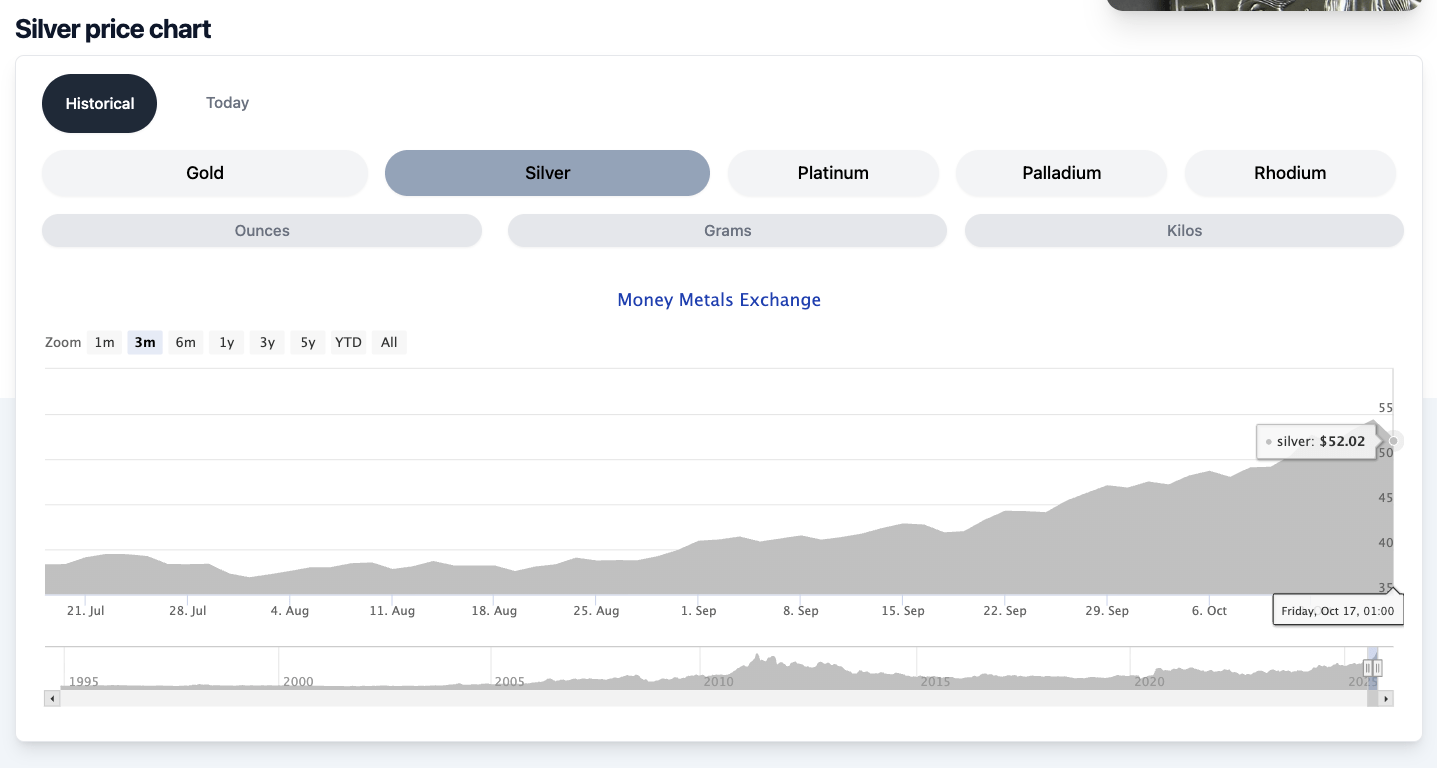
On September 18, silver was trading at $41.83. Over the next three weeks, silver rose to $54.32 an ounce, a 29.6 percent increase. It has since corrected, falling to $52 on Friday. But on Monday, the bulls were back in control, pushing silver back to $52.75.
The massive price runup in a matter of weeks is the very definition of overbought. But this rally is built on very strong fundamentals, indicating that it is not over-owned.
In a nutshell, the price of silver is rising because there simply isn’t enough metal to meet demand.
Silver demand has outstripped supply for four straight years. The structural market deficit came in at 148.9 million ounces last year. That drove the four-year market shortfall to 678 million ounces, the equivalent of 10 months of mining supply in 2024.
The Silver Institute projects a fifth straight supply deficit this year.
Movement of metal from London to New York earlier this year, due to tariff worries, drained LBMA vaults. This, coupled with a surge of investment demand and strong physical demand in India, led to a silver squeeze, pushing prices rapidly higher, resulting in this overbought situation.
There isn’t a quick, easy fix for the silver market.
This isn’t just a logistical problem. It is rooted in a fundamental lack of metal.
And you can’t print silver.
Technical signals for the bulls
When an asset is overbought, there is increased risk of a bull market pause, or even a reversal. However, along with the supply and demand dynamics, there are technical indicators that silver has plenty of room to move higher.
Even with the fast increase in the silver price, the gold-silver ratio still sits above 80-to-1, far above the modern average of around 60-to-1.
This indicates that silver is still significantly underpriced compared to gold.
Historically, whenever the spread grows this wide, silver rallies quickly to close the gap. This generally happens later in a gold bull market.
In 2020, for example, the ratio peaked at 123-to-1 before plunging to 60-to-1, propelling silver 80 percent higher in less than 20 weeks.
During the financial crisis of 2008–2011, the ratio dropped to 30-to-1 as silver surged to its 2011 record high.
By this measure, silver remains on sale compared to gold, with history suggesting a strong run is likely ahead.
Silver also just broke out of a classic cup and handle pattern.
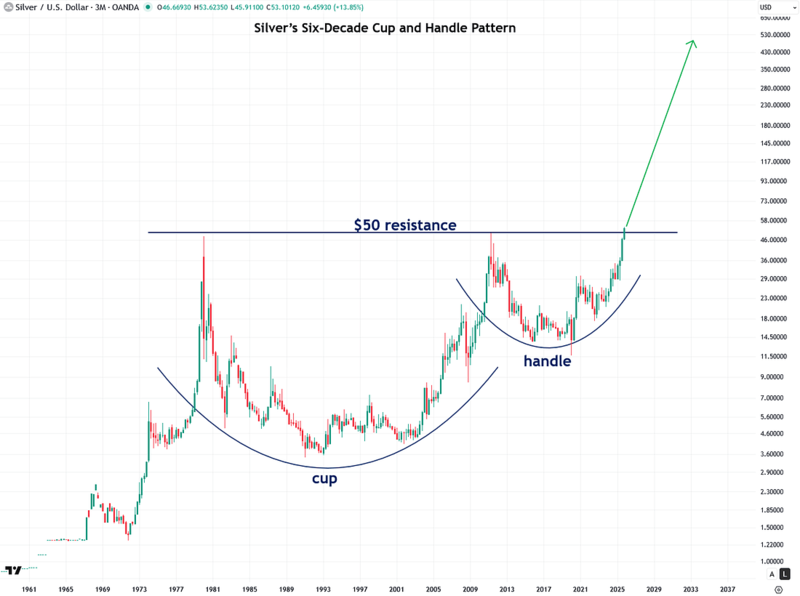
This is a long-term bullish pattern. You can see the “cup” with the twin highs of around $50 per ounce in 1980 and 2011. Following the 2011 peak, we see a sharp decline in the price, followed by a consolidation “handle.”
A handle pattern on the chart of a stock or commodity often precedes a breakout. Once the asset breaks above the handle (resistance), it typically portends a strong upward trend.
This silver cup-and-handle pattern has played out over an extremely long timeframe. Historically, longer patterns portend bigger breakouts with a broader base signaling a bigger upside case.
Gold followed a similar long-term pattern, resolving with a breakout to new all-time highs last year.
The current fundamental and technical dynamics indicate that the silver bull run isn't over. So, while silver is overbought, you shouldn't panic sell at the first sign of a downturn.
The market is extremely volatile right now. Silver is more volatile than gold to begin with, so price swings are to be expected. But remember, bull markets rarely go up in a straight line. Corrections are healthy and present buying opportunities.
To receive free commentary and analysis on the gold and silver markets, click here to be added to the Money Metals news service.
To receive free commentary and analysis on the gold and silver markets, click here to be added to the Money Metals news service.
Author

Mike Maharrey
Money Metals Exchange
Mike Maharrey is a journalist and market analyst for MoneyMetals.com with over a decade of experience in precious metals. He holds a BS in accounting from the University of Kentucky and a BA in journalism from the University of South Florida.


