Is Silver expensive?
Silver prices are surging toward $60 an ounce. The white metal finally broke out to new all-time highs two months ago -- at least without adjusting for inflation.
The average gold:silver ratio based on the following chart is 71:1, meaning it took 71 ounces of silver to buy one ounce of gold:
The average skewed significantly based on the six years between 2018 and 2024, an unusual period where silver prices generally languished relative to gold.
The ratio average between 1975 and 1990 was 55:1. Between 1991 and 2005, the average was 65:1. With the gold/silver ratio at 72:1 now, silver is still cheap relative to gold on a historical basis.
Let’s now compare silver to the value of U.S. equities. Below is a chart which shows the ratio of the S&P 500 to the silver price since the year 2000. The ratio began at nearly 300 ozs of silver to equal the value of the stock index. It then declined to below 50 when silver prices peaked in 2011.
In recent years, this ratio hovered near 180:1. But silver has dramatically outperformed the index in 2025 and currently resides near 118:1.
The ratio average for this time period is 146:1. This year’s performance means silver is more expensive than the average, but it remains well below the 2011 peak in value versus stocks.
The average for the past 50 years is 103:1, so silver still looks cheap based on the longer time frame.
Now, let’s take a look at silver prices versus the price of residential real estate. The chart below plots average annual silver prices versus the year-end Case-Shiller National Home Price Index for each year.
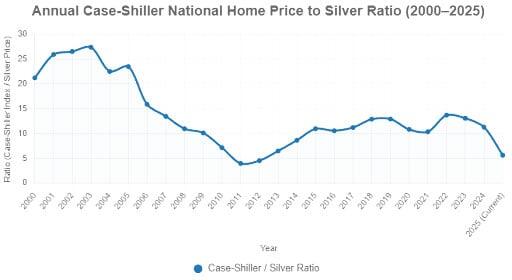
Silver is close to the 2011 peak in value versus single-family home values. Based on data from the past 25 years, it would be fair to say silver is getting expensive relative to residential real estate.
Of course, the steady erosion in the purchasing power of the Federal Reserve Note dollar has been a fundamental driver for both home prices and silver prices. Thus far, at least, silver has proven to be the better hedge against inflation.
That may continue given that home affordability is at historic lows. Fewer Americans can afford the price of entry into home ownership. But they can still buy silver.
To receive free commentary and analysis on the gold and silver markets, click here to be added to the Money Metals news service.
Author

Clint Siegner
Money Metals Exchange
Clint Siegner is a Director at Money Metals Exchange, the national precious metals company named 2015 "Dealer of the Year" in the United States by an independent global ratings group.

















