Is Silver About to Complete the Triangle?

Key Points:
-
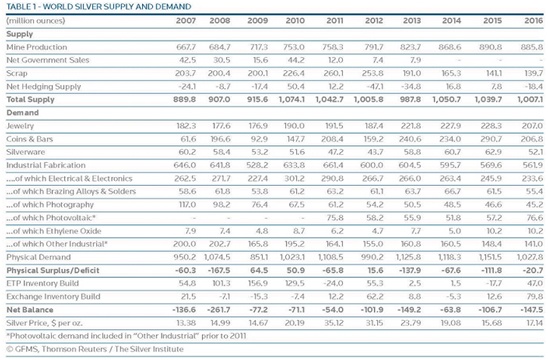
Silver continues to see supply/demand deficits in 2016.
-
RSI Oscillator trending higher within neutral territory.
-
Near completion of 5-drive suggests we could see a bullish wave.
Silver has been going through a cycle of declines of late as the precious metal has reacted to price action becoming trapped below a declining trend line and changing economics in the demand and production for Silver. However, presently there are some interesting technical indicators appearing on the daily chart which are likely to impact prices in the coming week.
Fundamentally, economists have been squawking lately about the slipping demand for silver in the photographic trade. They are right to point out that in the space of a decade demand has fallen by over 65% as we have transitioned almost totally to digital cameras. However, to put that in context balancing supply and demand numbers still shows that there was a deficit of -20.7 million ounces in 2016 and that’s with massively increased production. Subsequently, silver has experienced a supply deficit for every year since 2007, despite the fall in photographic demand.
Although the fundamental factors are long term in nature, the rising supply deficit largely agrees with what has been seen in the physical metals market with rising prices for actual silver coins and bars. Subsequently, it is no surprise that some bullish technical factors are now also starting to creep into the daily charts.
Although the fundamental factors are long term in nature, the rising supply deficit largely agrees with what has been seen in the physical metals market with rising prices for actual silver coins and bars. Subsequently, it is no surprise that some bullish technical factors are now also starting to creep into the daily charts.
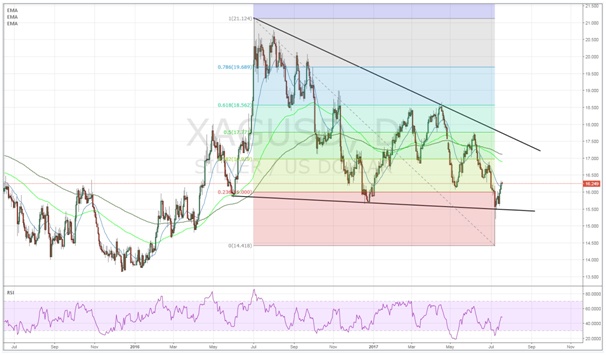
A cursory review of the various technical factors provides some illuminating hints at where the metal could be heading next. In particular, price action’s recent rebound from support around the $15.50 mark seems to suggest that there is building momentum for an upside move in the coming weeks. In addition, a relatively clear 5-wave structure is in place and moving higher to completion, which is normally followed by another bullish cycle. Also, the recent spike in prices has seen the RSI Oscillator trend away from oversold territory, and into the neutral zone, suggesting that there could be some space to run on the upside.
However, to cement a concerted move higher, price action will need to rally through the top of the descending trend line. Taking an Elliot wave view of the recent movements, a break above this level would provide a sharp indication of price movement. At the time of writing, the upper constraint is sitting right on the $17.50/ounce mark and a break above this level is relatively conceivable in the coming weeks given a range of factors.
Ultimately, Silver is going to re-price in the coming weeks especially if it can break through the current descending trend line. A fairly likely scenario would be one where price action trends towards $17.50 in a wave pattern. However, as to how far the metal can push above that level will rely strongly on the medium sentiment, which as I’m sure everyone appreciates, is difficult to predict in the medium term.
Author

Steven Knight
Knight Review
Independent economist and former Head of FX Research for an international brokerage, Steven Knight, possess a well founded reputation of direct, hard hitting analysis.


