Is Nvidia (NVDA) roaring back with buzz of artificial intelligence?

NVIDIA Corporation is best known for its graphic processing unit (GPU) products that are used extensively in gaming, graphics, high-performance computers, autonomous vehicles and many more applications. It also provides hardware and software in the artificial intelligence industry. NVDA is listed on NASDAQ and is a component of Nasdaq 100 and S&P 500 under Information Technology.
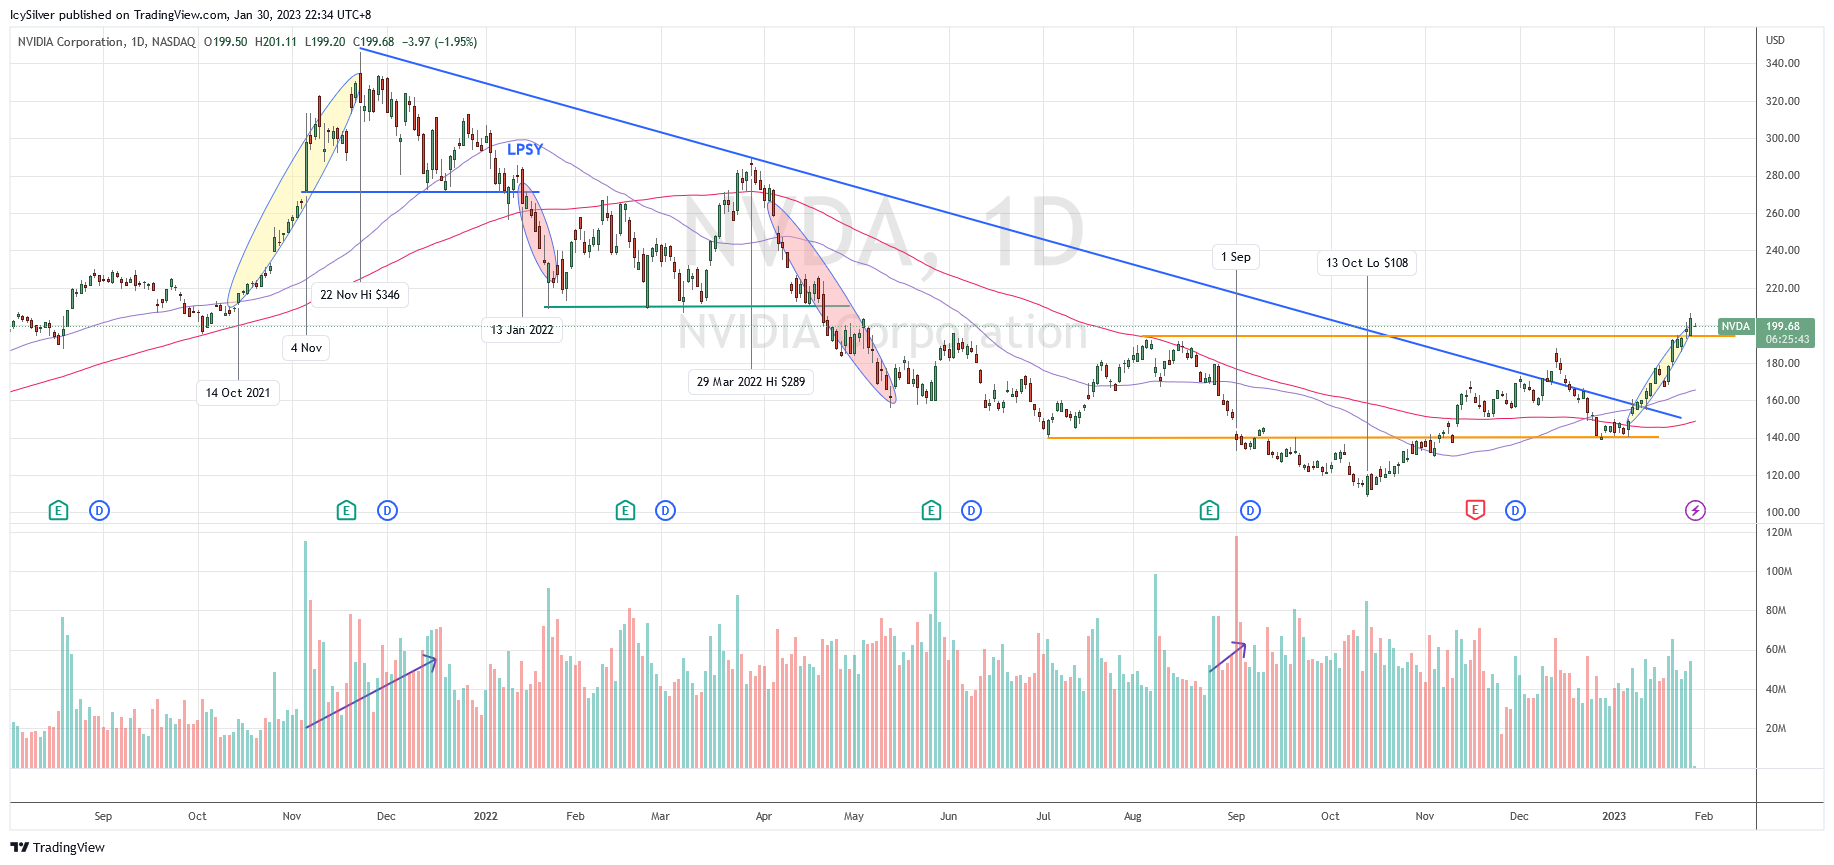
NVDA price started a climatic run up around 14 Oct 2021. The Wyckoff sign of strength (SOS) rally was significant. Although the volume spike on 4 Nov, the result is a bar with a rejection tail that suggests presence of supply and profit taking activities. The price did a minor pull back before hitting a high of $346 on 22 Nov. The follow through price action was retracement. On 13 Jan 2022, the price broke down the support around $272 in a Wyckoff last point of supply (LPSY) manner. This was followed by a Wyckoff sign of weakness (SOW) move down.
There were attempts to rally up to $289 on 29 Mar but the subsequent price action pointed to Wyckoff redistribution. More weakness ahead as confirmed by inability of the price to rally up. In contrast to the bar on 4 Nov 2021, the volume spike on 1 Sep 2022 suggests presence of demand. According to Wyckoff effort versus result theory, this is because the huge effort did not result in a big down bar. Despite that, the price continued to grind down and tested the low around $108 on 13 Oct.
The tide started turning after that and the price rallied back into the range between $140 and $200, which confirmed the previous presence of demand as stopping volume, changing the down trend to a trading range. The price retested the $140 and started a SOS rally. On 26 Jan 2023, it was able to break above $200 for the first time since Apr 2022.
Bias
Slightly bullish. According to the Wyckoff method, NVDA is at a pivotal point. The price just completed or is still completing the Wyckoff accumulation phase. It might retest the support of $200 and range between $180 and $210 in the back up phase before any significant moves up.
If the price breaks below $180, it will likely retrace to retest the low of $140.This NVDA was discussed in detail in my weekly live group coaching on 24 Jan 2023 before the market opened.
Author

Ming Jong Tey
Independent Analyst
Ming Jong Tey has been trading since 2008. He started his learning journey from technical analysis (indicators, Fibonacci, etc...) to value investing. Throughout his journey, he develops an interest in price action with chart pattern trading.


