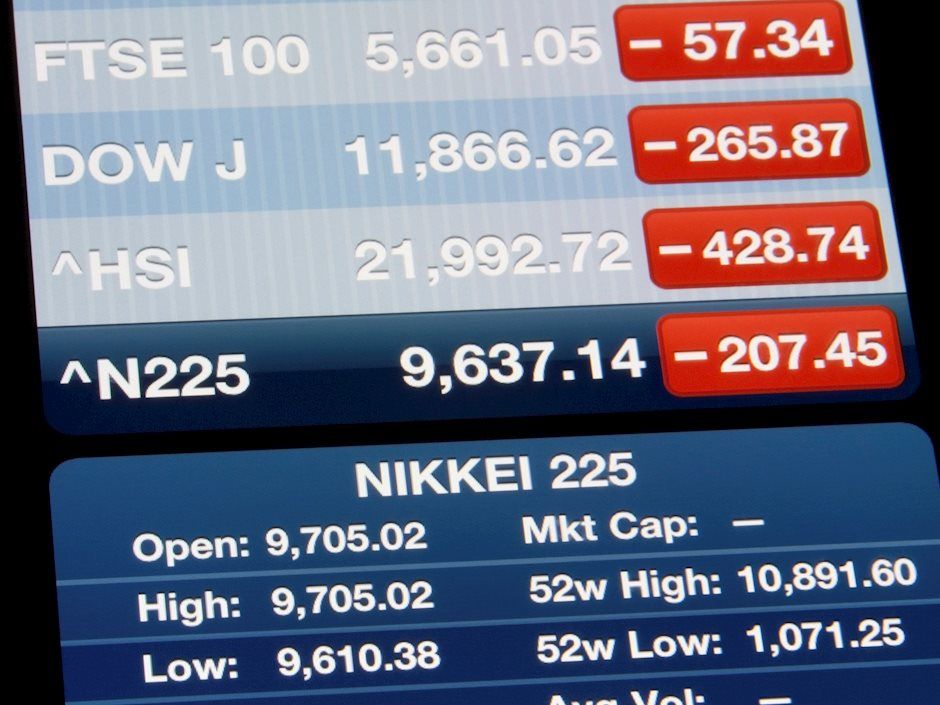
The inverse relationship between the Japanese Yen and Japan’s Nikkei index is a well know fact.

Though we should not take it for granted, still a lower Yen improves the competitiveness of the export-driven Japanese corporate sector - leads to more sales and earnings from overseas.

USD/JPY and Nikkei comparison - monthly chart

USDJPY And Nikkei Comparison

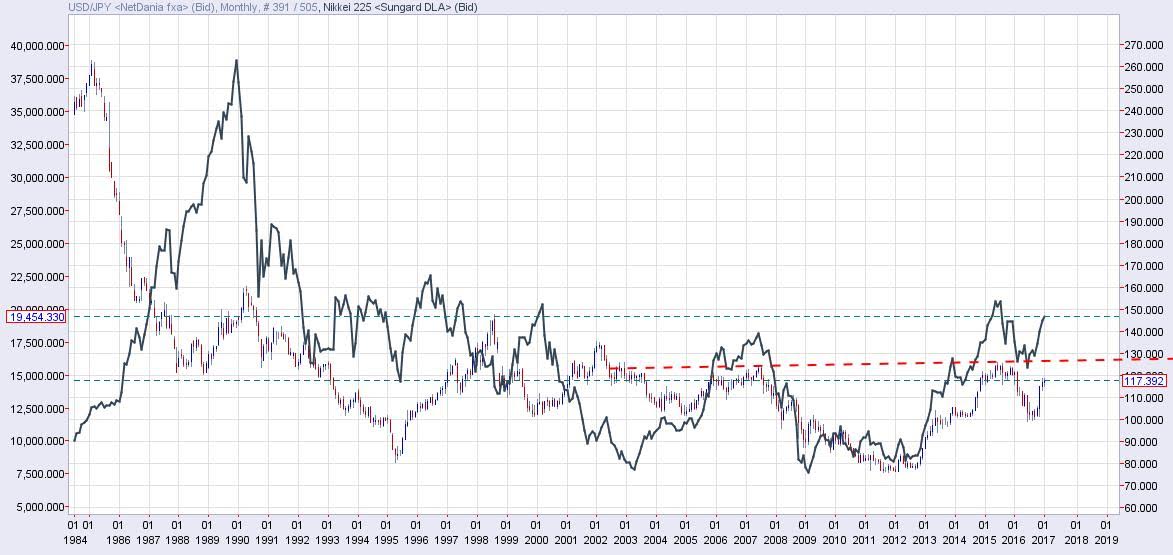
We can clearly see from the chart, that the direct relationship between USD/JPY and Nikkei (inverse relationship between Yen and Nikkei) is in place since early 1990.

Note how closely the Nikkei index is tracking the Dollar-Yen pair since late 2011.

Trumpflation is good for the Nikkei

The treasury yields could rise further in 2017 if Trump actually delivers on the promises he made during the Presidential campaign. This means further weakness in the Japanese Yen and a rise in the Japanese Yen.

Long-term bottom in USD/JPY

Monthly chart

USDJPY

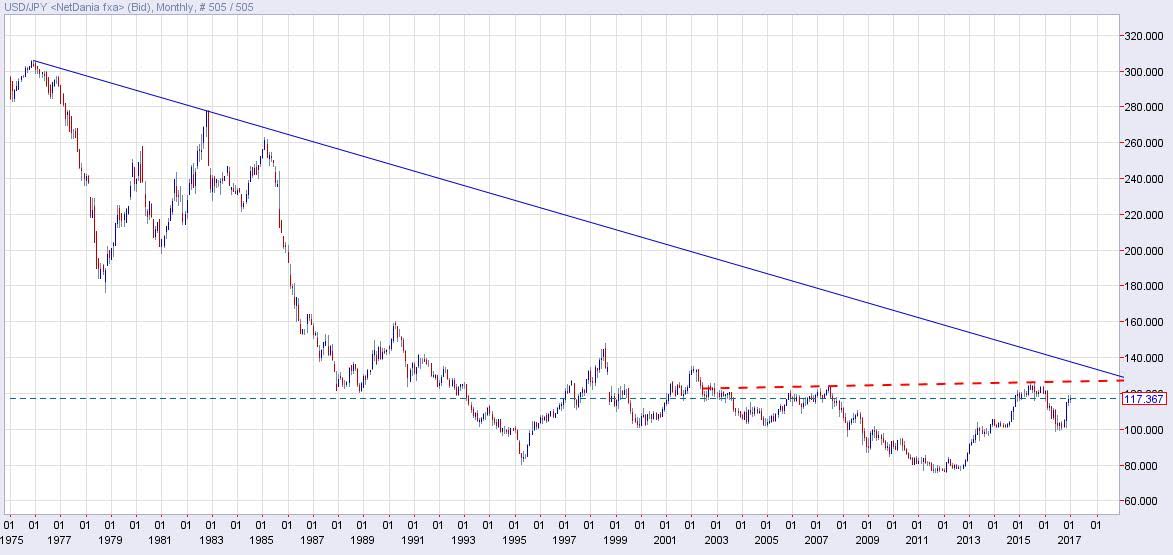
The pair is still in a long-term down trend. Take note of the falling trend line drawn from Dec 1975 high of 306.19 and Nov 1982 high.

However, what is more important is the fact that the spot is forming an inverse head and shoulder (bullish reversal pattern) at the bottom of the multi decade down trend.

On a larger scheme of things, the spot appears on track to test the inverse head and shoulder neckline level of 126.65.

Nikkei - Rounding bottom

Monthly chart

Nikkei

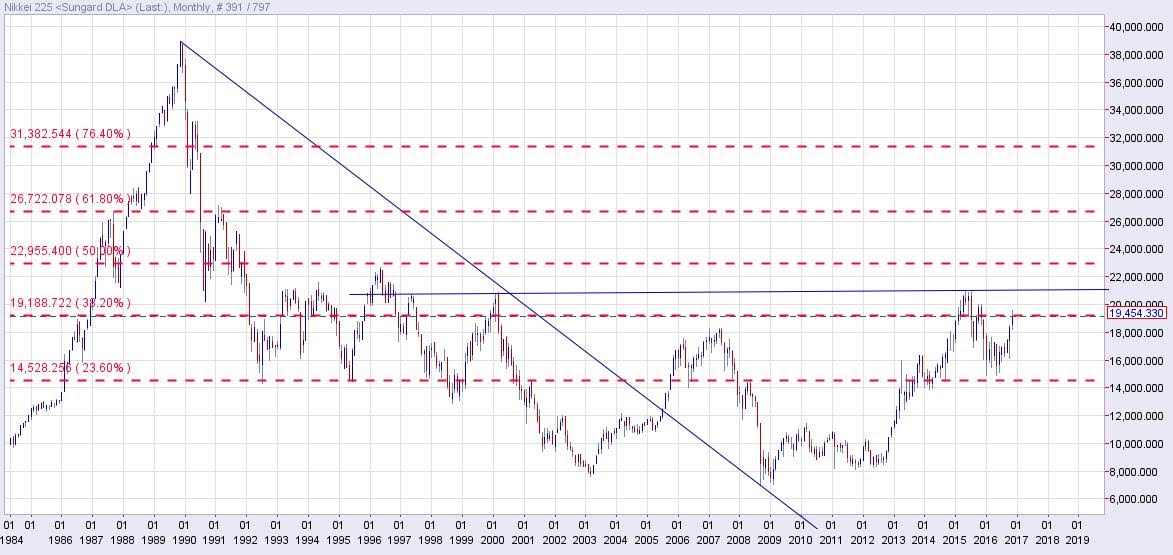
It should not come as a surprise that the Nikkei monthly chart shows a nice rounding bottom formation….Given the strong direct relationship between USD/JPY and Nikkei and an inverse head and shoulder pattern on the USD / JPY chart as discussed above.

The index looks set to test 21,000 levels in the short-run and may see an upside break if the Dollar-Yen pair sees a inverse head and shoulder breakout.

To conclude

  • Nikkei could outperform other major indices in 2017. The bullish outlook is at risk of a major sell-off in USD/JPY (rise in Yen), which as of now appears likely only if we have a ‘black swan’ event.

  • A break below 100.00 levels in USD/JPY would signal bullish invalidation in the Nikkei index.

Information on these pages contains forward-looking statements that involve risks and uncertainties. Markets and instruments profiled on this page are for informational purposes only and should not in any way come across as a recommendation to buy or sell in these assets. You should do your own thorough research before making any investment decisions. FXStreet does not in any way guarantee that this information is free from mistakes, errors, or material misstatements. It also does not guarantee that this information is of a timely nature. Investing in Open Markets involves a great deal of risk, including the loss of all or a portion of your investment, as well as emotional distress. All risks, losses and costs associated with investing, including total loss of principal, are your responsibility. The views and opinions expressed in this article are those of the authors and do not necessarily reflect the official policy or position of FXStreet nor its advertisers. The author will not be held responsible for information that is found at the end of links posted on this page.

If not otherwise explicitly mentioned in the body of the article, at the time of writing, the author has no position in any stock mentioned in this article and no business relationship with any company mentioned. The author has not received compensation for writing this article, other than from FXStreet.

FXStreet and the author do not provide personalized recommendations. The author makes no representations as to the accuracy, completeness, or suitability of this information. FXStreet and the author will not be liable for any errors, omissions or any losses, injuries or damages arising from this information and its display or use. Errors and omissions excepted.

The author and FXStreet are not registered investment advisors and nothing in this article is intended to be investment advice.

Recommended Content


Recommended Content

Editors’ Picks

EUR/USD clings to daily gains above 1.0650

EUR/USD clings to daily gains above 1.0650

EUR/USD gained traction and turned positive on the day above 1.0650. The improvement seen in risk mood following the earlier flight to safety weighs on the US Dollar ahead of the weekend and helps the pair push higher.

EUR/USD News

GBP/USD recovers toward 1.2450 after UK Retail Sales data

GBP/USD recovers toward 1.2450 after UK Retail Sales data

GBP/USD reversed its direction and advanced to the 1.2450 area after touching a fresh multi-month low below 1.2400 in the Asian session. The positive shift seen in risk mood on easing fears over a deepening Iran-Israel conflict supports the pair.

GBP/USD News

Gold holds steady at around $2,380 following earlier spike

Gold holds steady at around $2,380 following earlier spike

Gold stabilized near $2,380 after spiking above $2,400 with the immediate reaction to reports of Israel striking Iran. Meanwhile, the pullback seen in the US Treasury bond yields helps XAU/USD hold its ground.

Gold News

Bitcoin Weekly Forecast: BTC post-halving rally could be partially priced in Premium

Bitcoin Weekly Forecast: BTC post-halving rally could be partially priced in

Bitcoin price shows no signs of directional bias while it holds above  $60,000. The fourth BTC halving is partially priced in, according to Deutsche Bank’s research. 

Read more

Week ahead – US GDP and BoJ decision on top of next week’s agenda

Week ahead – US GDP and BoJ decision on top of next week’s agenda

US GDP, core PCE and PMIs the next tests for the Dollar. Investors await BoJ for guidance about next rate hike. EU and UK PMIs, as well as Australian CPIs also on tap.

Read more

Majors

Cryptocurrencies

Signatures